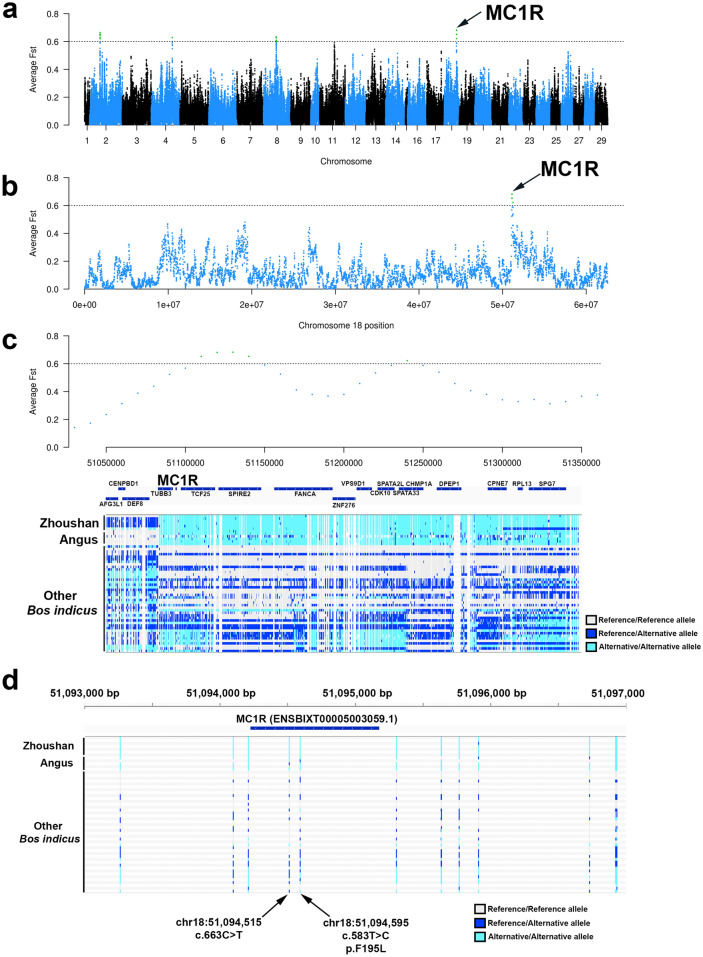
Figure 3.
Genomic regions associated with dark black coat colour of Zhoushan cattle. (a) Manhattan plot for average Fst values in 40 kb windows with 10 kb steps between Zhoushan cattle plus Angus and other B. indicus. A region with an average Fst of more than 0.6 is coloured in green. The arrow indicates the highest peak. The x-axis represents chromosomal positions, and the y-axis represents the average Fst values. (b) Manhattan plot on chromosome 18 for average Fst values in 40 kb windows with 10 kb steps between Zhoushan cattle, Angus, and other B. indicus. (c) Regional plot around the MC1R gene. The genotype of each individual at each variant site is shown. The genotype homozygous for the reference allele is coloured grey. Heterozygous variants are coloured blue. The homozygous genotype for alternative alleles is coloured light blue. Note that homozygous genotypes for alternative alleles are enriched in Zhoushan and Angus cattle in this region. (d) Regional plot showing the mutations around MC1R gene.

