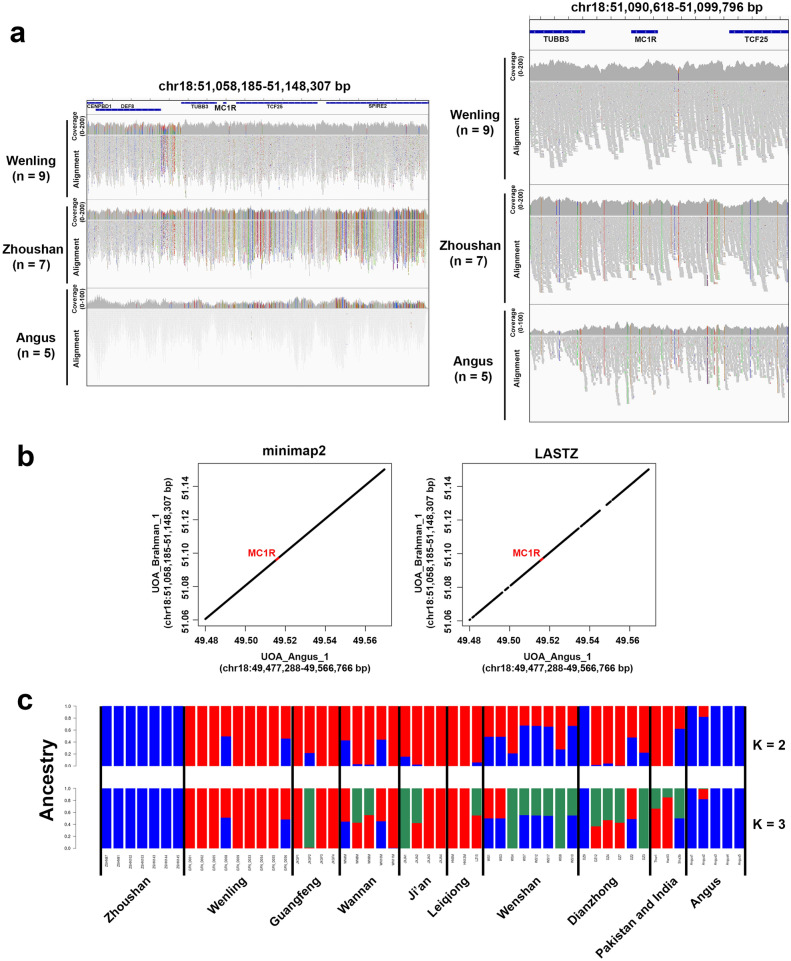
Figure 5.
Read depth distribution, genome alignment and admixture analysis of the MC1R region. (a) Read depth distributions in the MC1R region. The left panel shows the read depth distributions in the region from 51,058,185 to 51,148,307 bp on chromosome 18. The right panel shows the read depth distributions in the region from 51,090,618 to 51,099,796 bp on chromosome 18. For each breed, the sequencing reads were integrated. The first track represents read depth distribution in each breed, and the second track represents read alignments to the reference genome. For a given base position, if the base call in the sequencing read and the corresponding base in the reference genome are different, adenine is shown in green, thymine in red, guanine in orange, and cytosine in blue. (b) Dot plots showing the genome alignments of the MC1R regions of the UOA_Angus_1 assembly (chr18:49,477,288–49,566,766 bp) and the UOA_Brahman_1 assembly (chr18:51,058,185–51,148,307 bp). The left panel shows the genome alignment by minimap2 aligner and the right one shows the genome alignment by LASTZ aligner. The region corresponding to the MC1R gene body is highlighted in red. (c) Admixture analysis of the MC1R region. The SNPs located in the MC1R region (chr18:51,058,185–51,148,307 bp) were collected and subjected to admixture analysis. The order of the samples is the same as in Fig. 2a.

