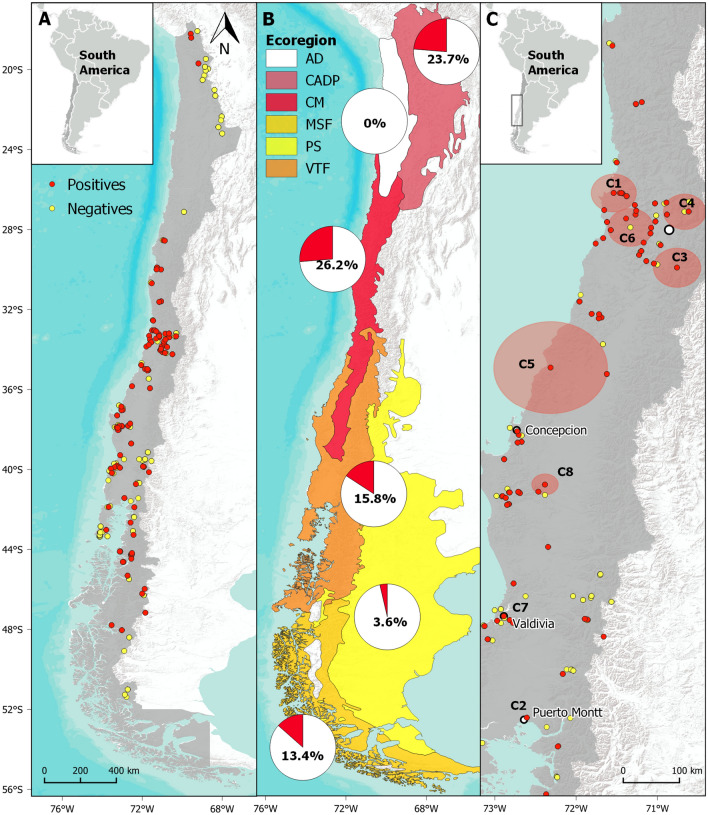
Figure 1.
Spatial distribution of Batrachochytrium dendrobatidis (Bd) infection in amphibian populations in Chile studied from 2008 to 2018. (A) Bd-positive (red dots) and Bd-negative (yellow dots) sites. (B) Proportion of Bd-positive amphibians (red portion of pie chart) according to ecoregions: Chilean Andean Dry Puna (CADP), Atacama Desert (AD), Chilean Matorral (CM), Valdivian Temperate Forest (VTF), Patagonian Steppe (PS) and Magellanic Subpolar Forest (MSF). (C) Eight statistically significant (P < 0.05) spatial clusters of Bd high-risk areas (C1 to C8) obtained from scan statistics analysis. All clusters were located in central and south Chile. Most clusters are represented by red shaded circles, apart from C2 and C7 which were smaller in size. Maps and rasters were generated using QuantumGIS v.3.8.2 (QGIS Geographic Information System). Open Source Geospatial Foundation Project. http://qgis.osgeo.org (2018).

