
Figure 3.
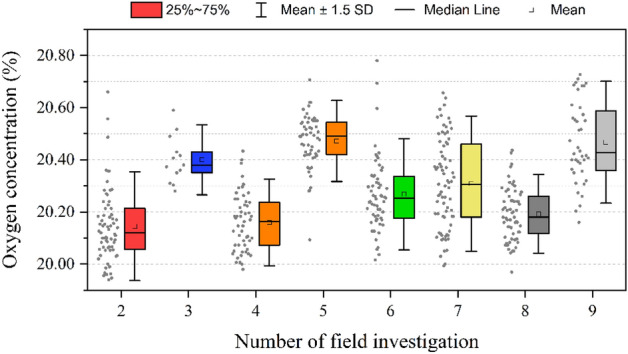
Box plots of oxygen concentration of field investigations during 2018–2020. The numbers of field investigation are the same with those in Table S2 of Supplementary Materials.
Official websites use .gov
A
.gov website belongs to an official
government organization in the United States.
Secure .gov websites use HTTPS
A lock (
) or https:// means you've safely
connected to the .gov website. Share sensitive
information only on official, secure websites.
Box plots of oxygen concentration of field investigations during 2018–2020. The numbers of field investigation are the same with those in Table S2 of Supplementary Materials.