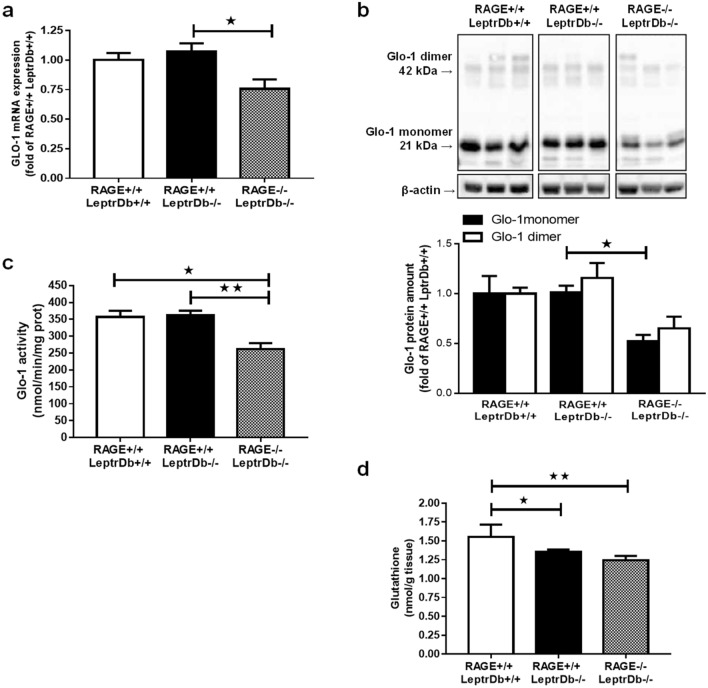
Figure 4.
Glyoxalase-1 (Glo-1) expression and activity and glutathione levels. (a) PCR analysis for gene expression of Glo-1 in liver from lean controls (RAGE+/+LeptrDb+/+), obese (RAGE+/+LeptrDb−/−), and RAGE KO obese (RAGE−/− LeptrDb−/−) mice. (b) Western blotting analysis for Glo-1 protein levels in liver extracts. Histograms report the densitometric analysis normalized for β-actin content. (c) Glo-1 enzymatic activity detected in liver lysates. (d) Total glutathione in liver lysates. Data are means ± SEM of 4–6 animals per group. Statistical significance: *P < 0.05; **P < 0.01; ***P < 0.001.

