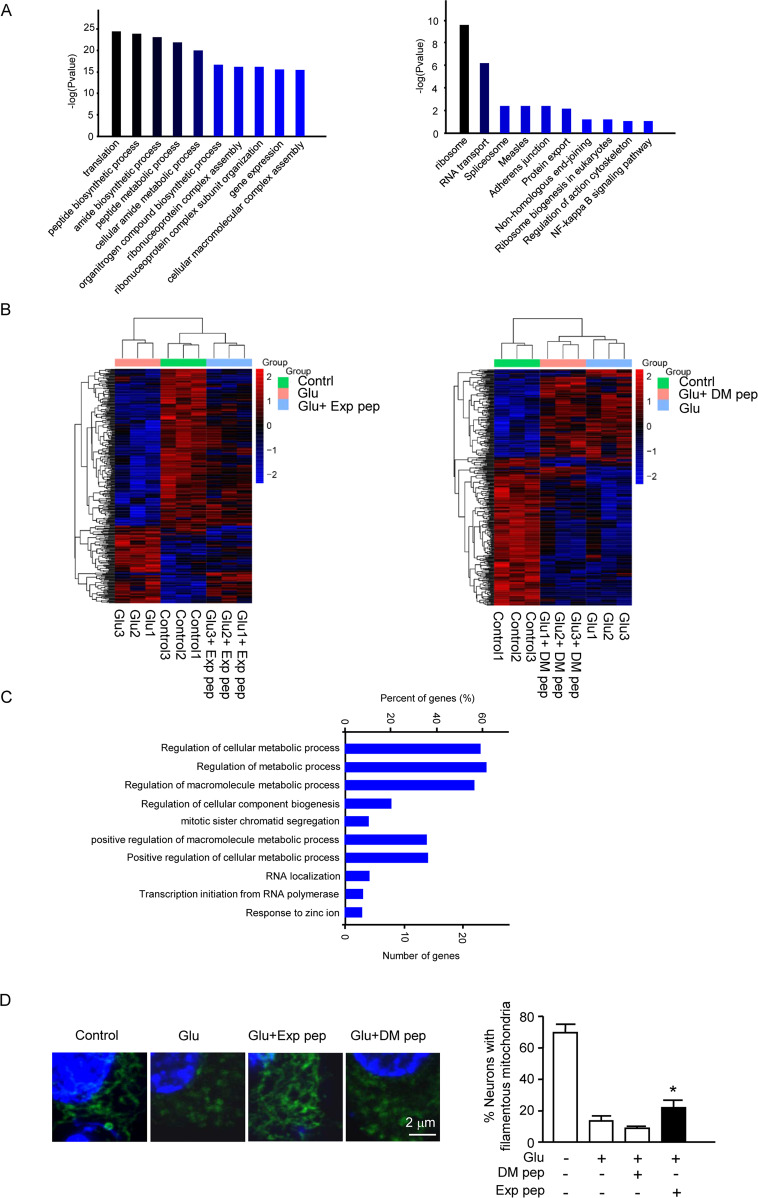
Fig. 5. The proteomic analysis to determine tRF and glutamate effect on metabolism.
A One hour after transfection of the cytotoxic tRF, total proteins were collected and analyzed by proteomics. The results of GO and KEGG analysis were shown. Four independent samples were collected for each treatment. These samples were treated as a group to compare between groups. The enriched biological processes and pathways are indicated on the graph. B Three hours after glutamate treatment with or without Exp pep or DM pep pretreatment, total proteins were collected and analyzed by proteomics. Trial n = 3. The heat map showed reduced protein level after glutamate treatment, and Exp pep (but not DM pep) rescued the protein level reduction. C The result of the GO analysis was showed for the downregulated protein after glutamate treatment. D Mitochondrial fragmentation in neuronal necrosis. Forty minutes after glutamate treatment with or without pretreatment of Exp pep or DM pep, the primary neurons were fixed and immune-stained with TOM20 to label mitochondria. The number of neurons displayed with fragmented mitochondria were determined. Trial n = 4. For each treatment, 15 randomly selected fields were examined for each trial.

