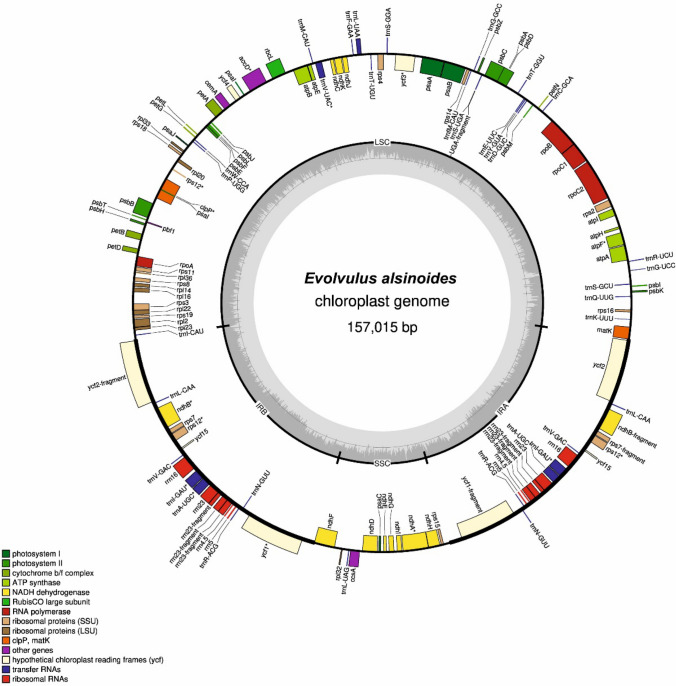
Fig. 1.
cp genome map of E. alsinoides. Genes in the inner circle are transcribed clockwise, and genes in the outer circles are transcribed in counter-clockwise direction. The IR/LSC/SSC boundaries are represented in the inner circle. The inner grey circle represent the GC and AT content of the cp genome

