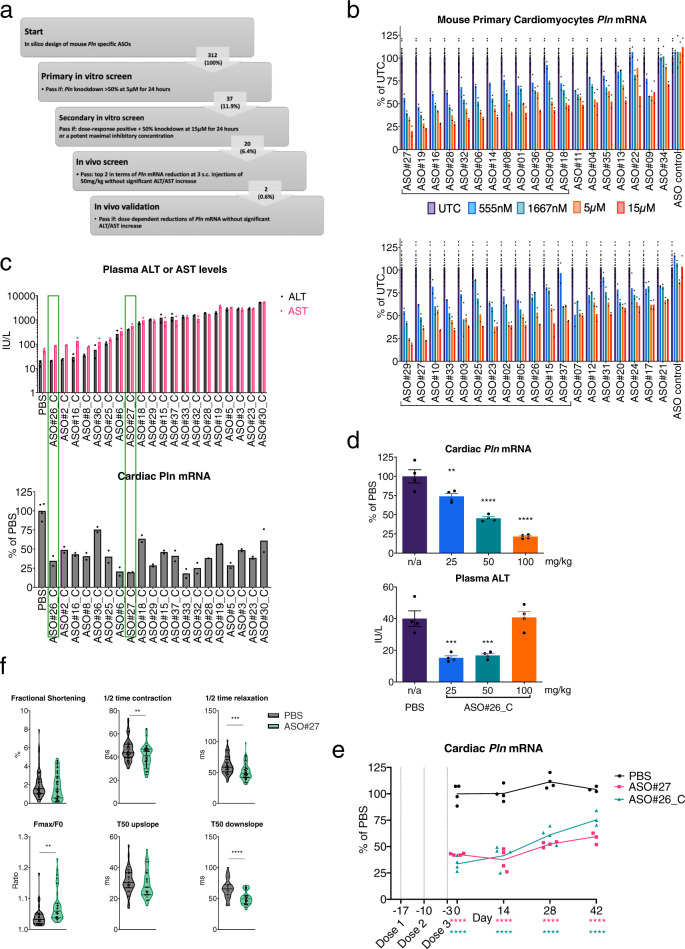
Fig. 1. A large in vitro and in vivo screen resulting in a PLN ASO that dose-dependently decreases cardiac Pln mRNA and improves in vitro calcium fluxes.
a Schematic illustration of experimental steps leading to identification of 2 mouse PLN ASO leads for in vivo studies. b Results of secondary in vitro screen illustrating Pln mRNA reductions in primary mouse cardiomyocytes in a dose–response comparison. ASO candidates were selected (20) based on demonstrated dose–response and >50% Pln mRNA reduction after 24 h of treatment, N = 24 for untreated control (UTC) and N = 2 for each PLN ASO. c Selection of 2 ASO leads from in vivo screen in healthy C57BL/6 mice based on heart Pln mRNA reductions and plasma ALT and AST after 3 s.c. injections of 50 mg/kg, N = 4 for PBS and N = 2 for each PLN ASO. d In vivo dose–response reductions of cardiac Pln mRNA by PLN-ASO#26_C (s.c. administration of 3 × 25, 50 or 100 mg/kg, analysis after 2 weeks) and plasma analysis for ALT levels, N = 4 per group. e Comparable sustained cardiac Pln mRNA downregulation achieved with 3 × 50 mg/kg (day −17, −10, and −3) palmitate PLN-ASO#26_C and 3 × 100 mg/kg (day 0, 7, and 14) nonconjugated PLN-ASO#27. Protein analysis was performed on day 17, 31, 45, and 56, N = 4 per group. f In vitro response to 30 h exposure to 15 μM ASO#27 or PBS. Neonatal mouse cardiomyocytes were cultured on micropatterned flexible substrates in islands. Fractional shortening was determined using the BASiC technique (N = 51 for PBS and N = 57 for PLN ASO), and 20 min Fluo-4 incubation was performed to assess calcium cycling (N = 34 for PBS [N = 33 for T50 downslope] and N = 31 for PLN ASO). Violin plots with individual dots and median and interquartile range or histograms with standard error of the mean (SEM) are depicted. Students’ T test and one-way analyses of variance were used for statistical analysis. Asterix denotes significance level based on two-sided P values compared to PBS with: *P value < 0.05; **P value < 0.01; ***P value < 0.001; ****P value < 0.0001. ASO antisense oligonucleotide, ALT Alanine transaminase, AST Aspartate transaminase, UTC untreated control, Fmax maximal fluorescence, F0, minimal fluorescence. Source data are provided as a Source Data file.

