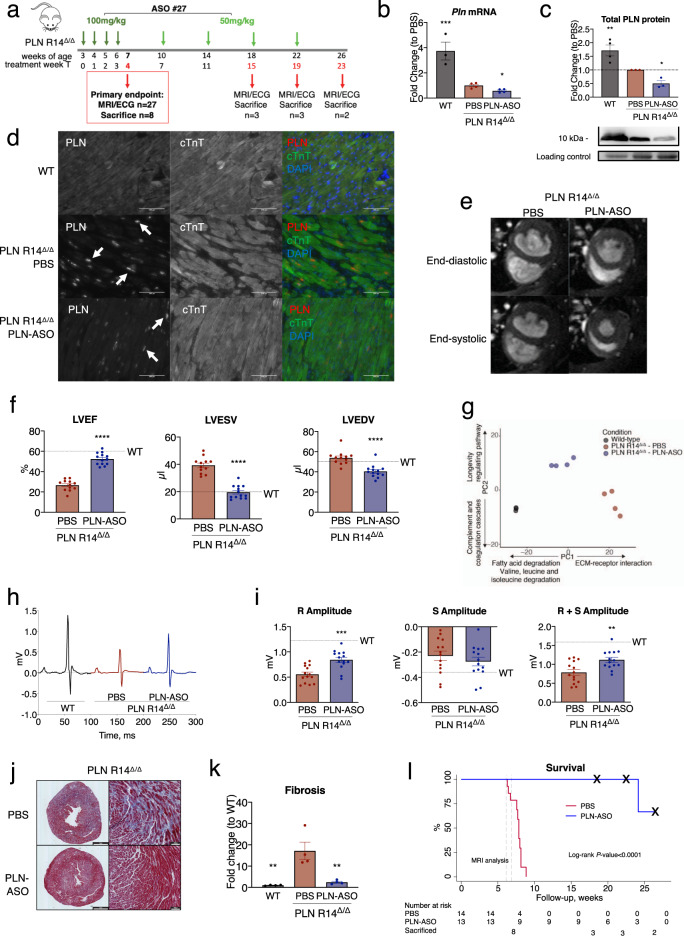
Fig. 2. Repeated subcutaneous injection of PLN ASO in mice with PLN R14Δ/Δ prevents cardiac dysfunction and improves survival.
a Experimental design of the PLN R14Δ/Δ intervention study, consisting of ASO#27 treatment with a 4-week loading phase with weekly dosing of 100 mg/kg and a 20-week maintenance phase with dosing of 50 mg/kg once every 4 weeks. Data points for functional and biochemical assessments were obtained at treatment week 4 (T4) which was the primary endpoint, 15 (T15), 19 (T19), and 23 (T23) at the end of the study. b SYBR green qPCR results of cardiac Pln mRNA expression (n = 3 for wild-type [WT] and n = 4 for PBS and PLN-ASO). c Semi-quantified western blot analysis of PLN protein expression using LV protein lysates. Intensities were normalized to total protein loading control and the PBS treated mice (n = 3 per group). d Immunofluorescence of WT, PBS treated and PLN-ASO treated PLN R14Δ/Δ mice after 4 weeks treatment. Sections were co-stained for cardiac Troponin T (green), PLN (red), and DAPI (blue). Note the lower presence of visible PLN aggregations (white arrows) and the higher structural integrity of the PLN-ASO treated hearts vs. PBS control. Stainings were performed in two animals per group. e Representative MRI images after 4 weeks of treatment. f Quantification of LVEF (left ventricular ejection fraction), LVESV (left ventricular end-systolic volume), and LVEDV (left ventricular end-diastolic volume) (n = 12 for PBS T4, n = 13 for PLN-ASO T4). Wild-type data were previously published, and the average is presented here for reference. g Principle component analysis plot of the first 2 principle components derived from the RNA-sequencing of mice left ventricles. h Representative ECG tracing of mice after 4 weeks of treatment. i Quantification of R, S, and R + S amplitude (n = 14 for T4) Wild-type data were previously published and the average is presented here for reference. j Representative Masson’s trichrome staining after 4 weeks of treatment of PBS and PLN-ASO treated PLN R14Δ/Δ cardiac sections. Stainings were performed in four animals per group. k Quantification of myocardial fibrosis based on Masson’s trichrome staining whereby the blue, fibrotic area is presented as the fold change compared to wild-type in percentage of the total tissue slice surface (n = 4 for all groups). l Kaplan–Meier survival plot of PLN R14Δ/Δ animals treated with PLN-ASO (n = 13) and PBS (n = 14). Three PBS treated animals died during MRI imaging, the other PBS treated animals died at around 8 weeks of age. The “x” marks the 3-time points at which animals were sacrificed for tissue analyses. One-way analysis of variance was used for statistical analyses, with PBS treated animals as the reference group in multiple comparison analyses. Asterix denotes significance level based on two-sided P values compared to PBS with: *P value < 0.05; **P value < 0.01; ***P value < 0.001; ****P value < 0.0001. Single values are depicted, and error bars represent the standard error of the mean (SEM). ASO antisense oligonucleotide, MRI magnetic resonance imaging, and ECG electrocardiogram. Source data are provided as a Source Data file.

