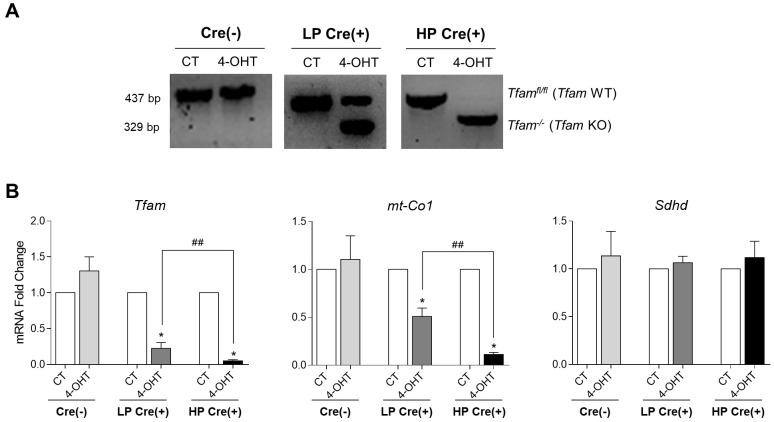
Fig. 2.
Expression of Tfam and mitochondrial-related genes. (A) PCR analysis of Tfam genotype in treated (4-OHT) or untreated (CT) Cre(+) SK-FBs cultured for low (LP) or high (HP) passages and Cre(−) SK-FBs. [Cre(−) SK-FBs are pooled LP and HP because we found no differences between them.] (B) qRT-PCR analysis of Tfam, mt-Co1 and Sdhd transcript levels in Cre(−) cells (n=6) and LP or HP Cre(+) cells (n=7) (mean±s.e.m.) (*P<0.05, Wilcoxon test; ##P<0.01, Mann–Whitney test).

