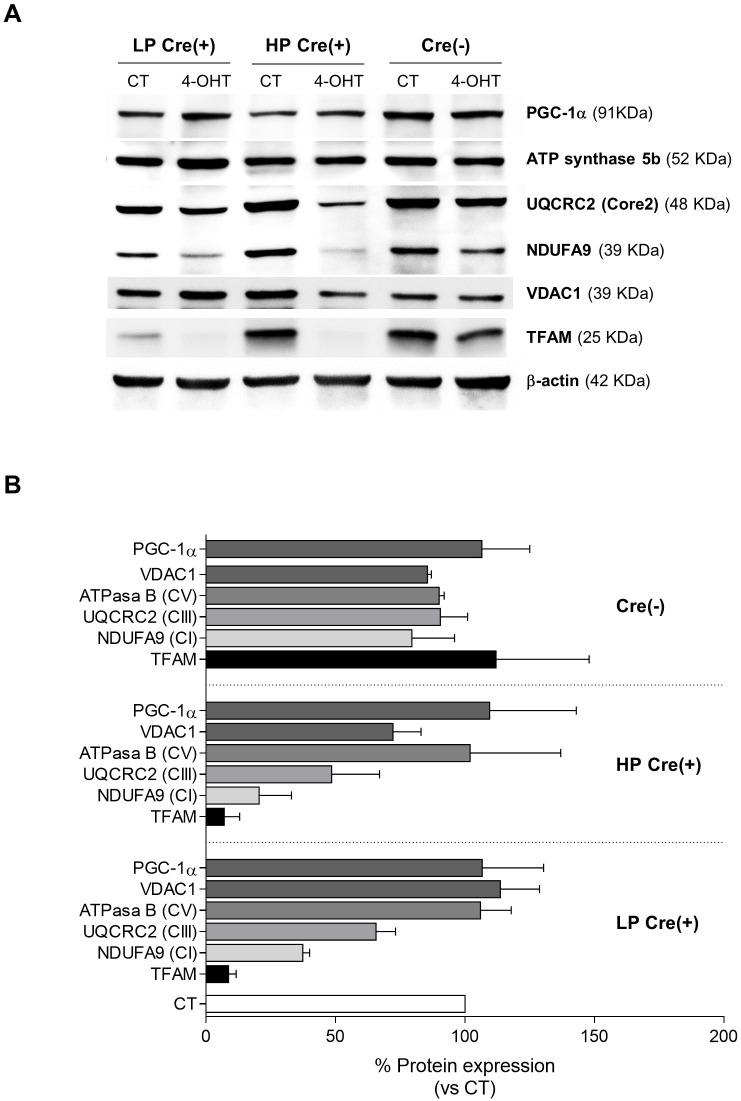
Fig. 3.
Expression of TFAM and mitochondrial proteins. (A) Representative western blots of TFAM, PGC-1α, ATP synthase subunit 5b, VDAC1, UQCRC2 (core protein 2) and NDUFA9 proteins in LP or HP Cre(+) and Cre(−) cell lines. (B) Densitometric quantification of protein expression, shown as the percentage of CT cells for each cell line. Cre(−) (n=2) and LP and HP Cre(+) (n=3) were used (mean±s.e.m.).

