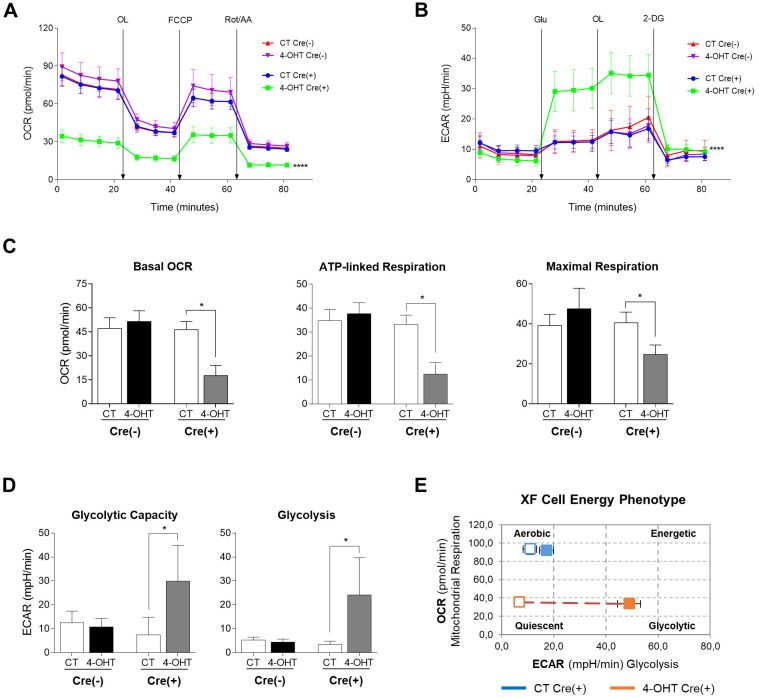
Fig. 6.
Mitochondrial function and glycolytic activity in HP SK-FBs. (A) OCR in mito-stress test, basal and after consecutive injections of OL, FCCP and Rot/AA (****P<0.0001, two-way ANOVA with Tukey's multiple comparison test). (B) ECAR in glycolysis-stress test, basal and after sequential injections of Glu, OL and 2-DG (****P<0.0001, two-way ANOVA with Tukey's multiple comparison test). (C) Quantification of basal OCR, ATP-linked respiration and maximal respiration (*P<0.05, Wilcoxon test). (D) Quantification of glycolytic capacity and glycolysis (*P<0.05, Wilcoxon test). (E) Representation of the XF cell energy phenotype. Treated (4-OHT) and untreated (CT) Cre(−) (n=3) and Cre(+) (n=3) SK-FBs are shown (mean±s.e.m.).

