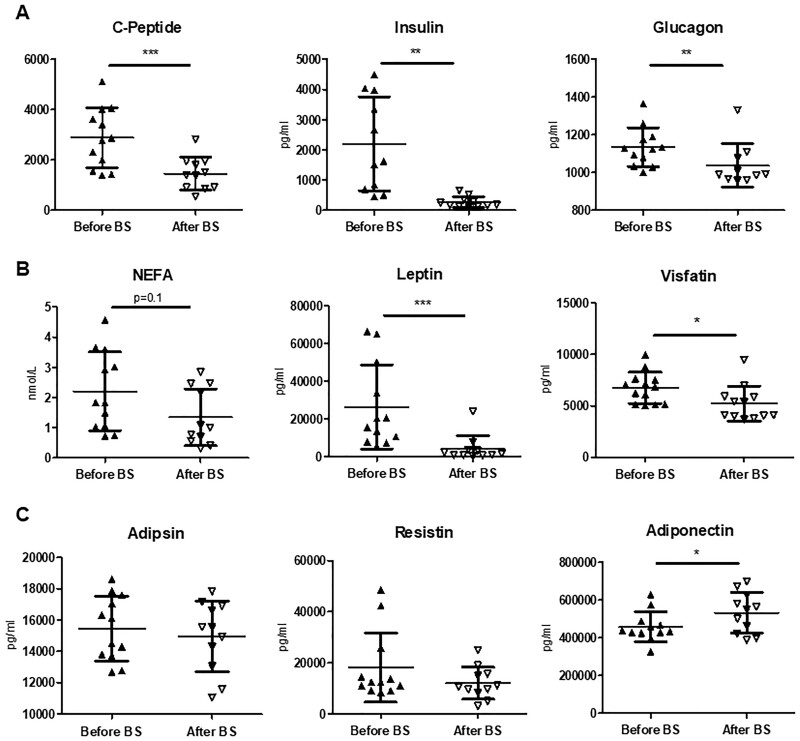
FIGURE 2:
Analysis of the circulating levels of C-peptide, insulin, glucagon and adipose tissue–derived molecules before and after BS. Levels of (A) C-peptide, insulin and glucagon;(B) non-sterified fatty acids and the adipokines leptin and visfatin; and(C) adipsin, resistin and adiponectinwere determined in serum samples of patients before and 12 months after BS. Data are shown as mean ± SD (n = 10–11). Statistical analysis was performed using the Student’s t‐test for paired samples or Wilcoxon matched-pairs test. *P < 0.05, **P < 0.01, ***P < 0.001.

