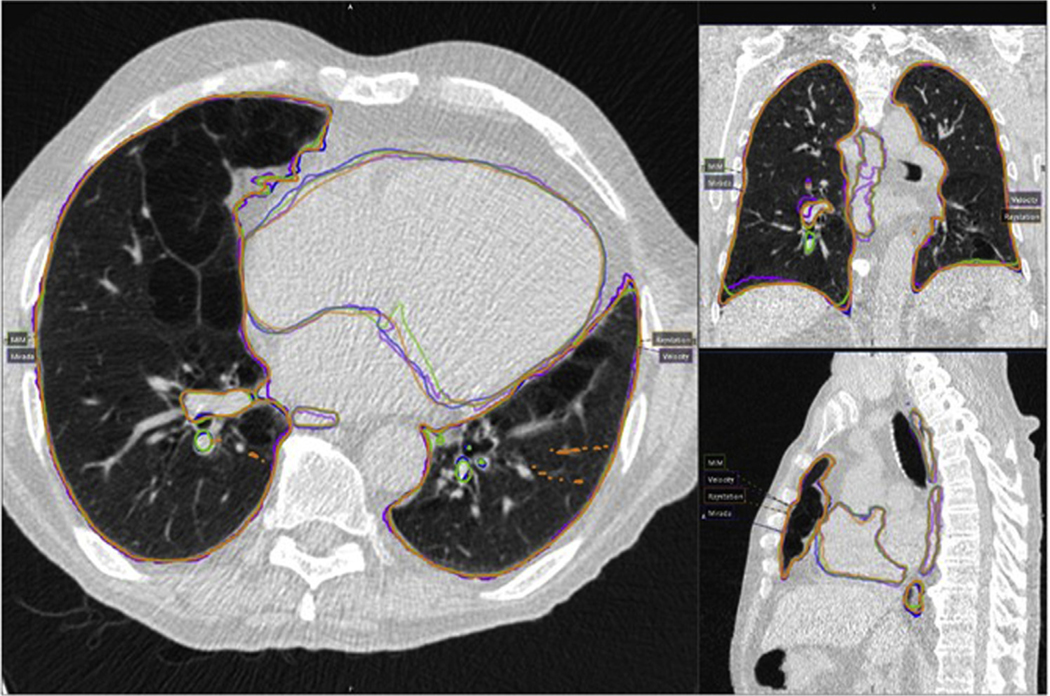
Figure 2.
An example of the propagated structures from CT 50% phase to CT 00% phase comparing all 4 commercial systems. Magenta: Velocity; blue: Mirada; green: MIM; orange: Raystation. (A color version of this figure is available at https://doi.org/10.1016/j.prro.2021.02.007.)

