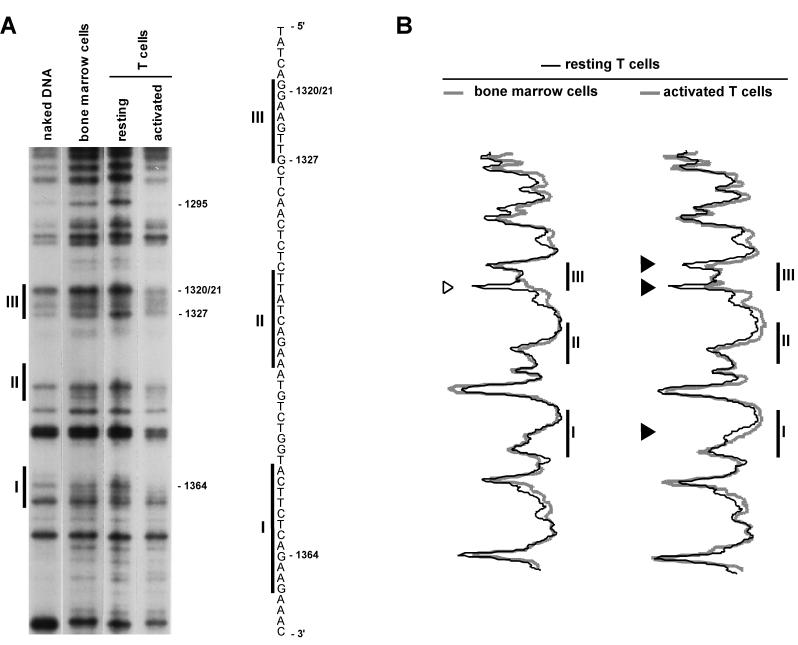
FIG. 4.
T-lymphocyte activation results in genomic footprints in the IL-2rE. LMPCR was performed with in vitro-methylated liver DNA or in vivo-methylated DNA from bone marrow cells, resting T lymphocytes, and T cells stimulated with ConA and IL-2 for 72 h. (A) Guanine sequence of the lower strand. The positions of the three sites that constitute the IL-2rE are shown to the left. The positions of the guanine residues, the methylation of which varies, are indicated on the right. The autoradiogram is representative of four independent experiments. (B) Histogram representation of the sequences shown in the gel presented in panel A. The gel was scanned with a phosphorimager, and histograms of the different lanes were overlaid. Each peak in the histogram corresponds to a band in the gel. Solid arrowheads indicate guanine bases which are partially protected in activated T cells. The open arrowhead points to a guanine residue at the border of site III with increased sensitivity to DMS in resting T cells.

