Figure 2.

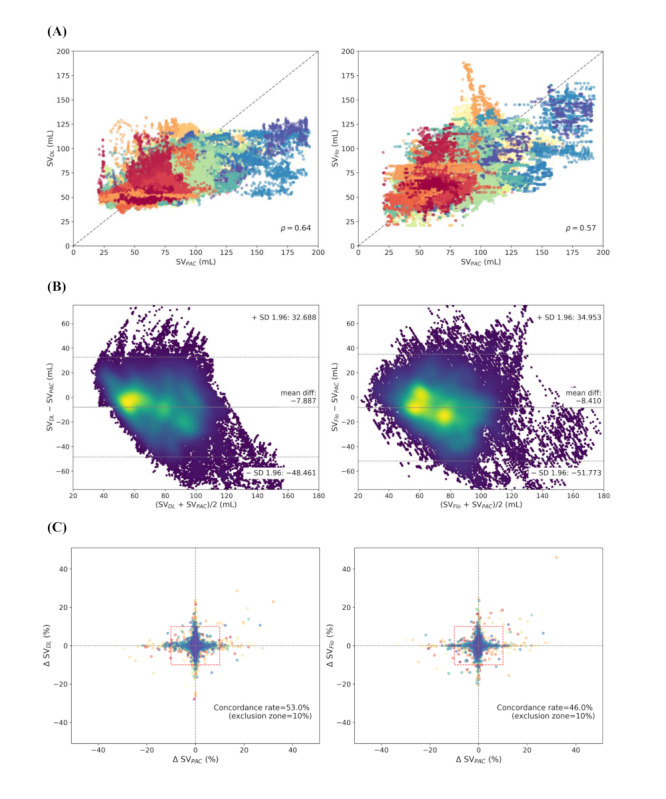
Scatter plot. (A) Bland-Altman plot with density highlight. (B) Four-quadrant plots. (C) Plot between target stroke volume and predicted stroke volume. DL: deep learning; Flo: FloTrac; PAC: pulmonary artery catheter; SV: stroke volume.

Scatter plot. (A) Bland-Altman plot with density highlight. (B) Four-quadrant plots. (C) Plot between target stroke volume and predicted stroke volume. DL: deep learning; Flo: FloTrac; PAC: pulmonary artery catheter; SV: stroke volume.