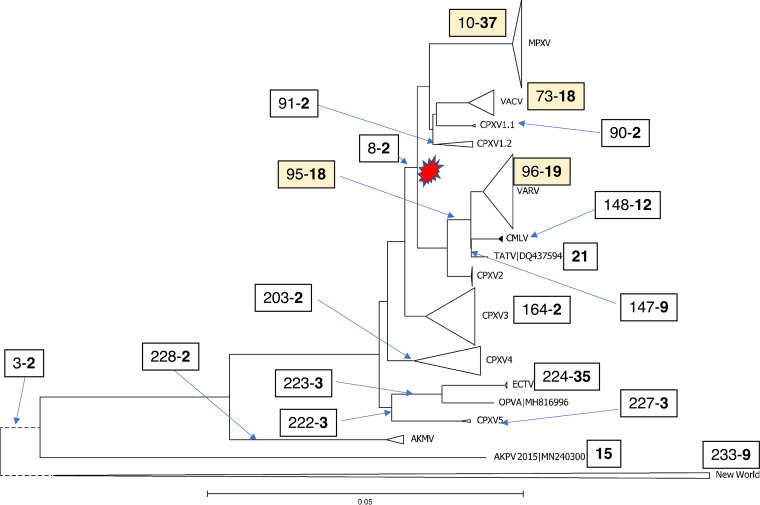
FIG 3.
Phylogenetic tree of ORPV and gene loss in ORPV evolution. The large branches are collapsed and shown with triangles. Each box associated with a tree branch shows the node number from which the branch emits (see Fig. S2) and the number of genes inferred to have been lost at the branch (numbers in bold). The four colored boxes show major clades with many genes lost at the stem. For branches without associated boxes, no or one gain was inferred. The red shape shows the high-loss clade of ORPV.

