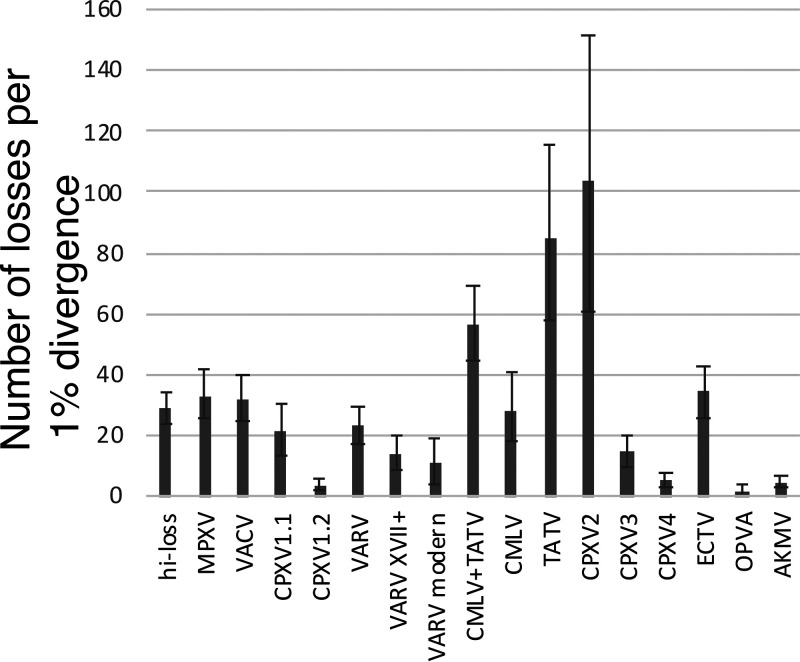
FIG 4.
Estimated rates of gene loss in the major clades of ORPV. The plot shows the loss rate in the stem of the respective clade and each of the branches within the clade. The gene loss rates were estimated as the number of genes lost per 1% nucleotide distance from the common ancestor of the respective group. Whiskers show the 90% confidence interval (5th and 95th percentile of the loss rates across 1000 bootstrap samples of genes).

