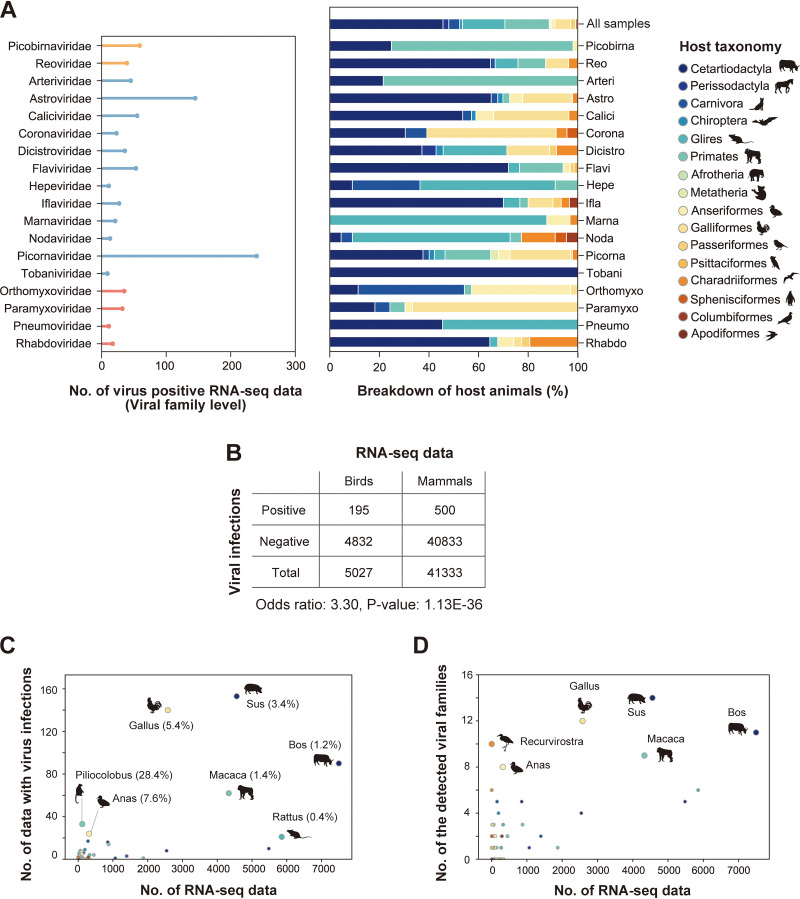
FIG 2.
RNA viral infections in the public sequencing data. (A) RNA viral infections detected in public sequencing data. Left panel, the x axis indicates the number of virus-positive RNA-seq data, and the y axis indicates viral families. Although infections by 22 RNA viral families were identified in this study, 18 families that were detected in more than five RNA-seq data are shown here. Bar colors correspond to the Baltimore classification: orange, dsRNA viruses; blue, ssRNA(+) viruses; red, ssRNA(−) viruses. Right panel, breakdown by host animals in which viral family infections were detected. The filled colors correspond to the host taxonomy shown in the key. The top row indicates the animal-wide breakdown of all RNA-seq data used in this study. (B) Comparison of viral detection rates between avian and mammalian samples. The table shows the numbers of RNA-seq data with and without viral infections. The odds ratio and P value were obtained by Fisher’s exact test. (C) Scatterplot between the numbers of RNA-seq data investigated in this study (x axis) and those with viral infections (y axis). Each dot indicates the animal genus. Dot colors correspond to the host taxonomy shown in panel A. The animal genera in which viral infections were detected in ≥20 samples are annotated with the representative animal species silhouettes. The percentages in parentheses indicate the ratios of virus-positive RNA-seq data to the investigated data. (D) Scatterplot between the number of RNA-seq data investigated in this study (x axis) and those of detected viral families (y axis). Each dot indicates the animal genus. Dot colors correspond to the host taxonomy shown in panel A. The animal genera in which eight or more viral families were detected are annotated with the representative animal species silhouettes.

