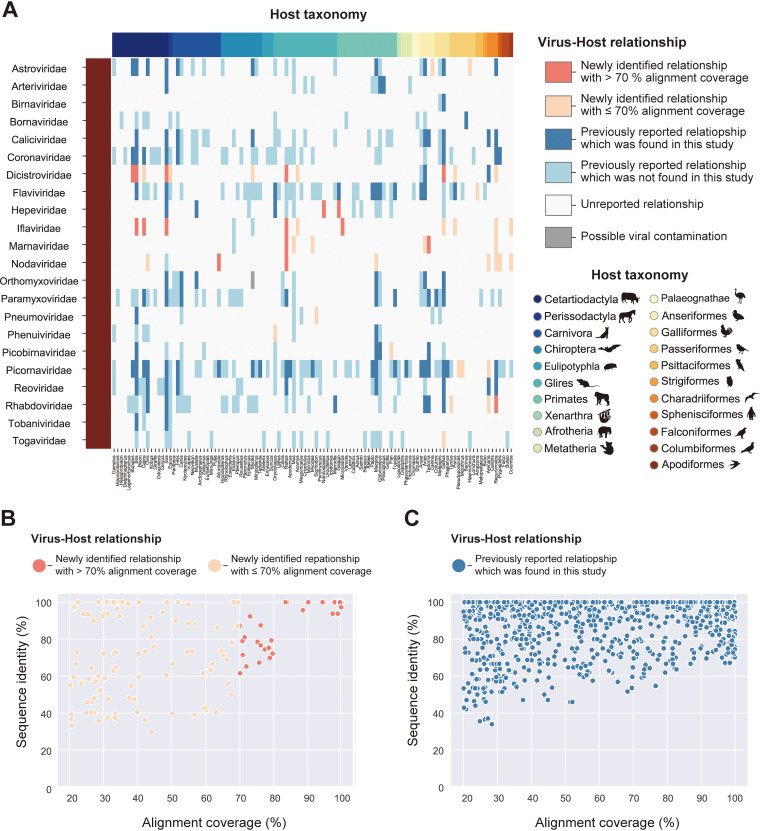
FIG 3.
Search for unknown reservoir hosts and novel virus sequences. (A) Heatmap showing the newness of virus-host relationships. Rows indicate viral families that reportedly infect vertebrate hosts. Columns indicate animal genera, and filled colors correspond to the host taxonomy shown in the lower right corner. Heatmap colors are according to six categories of virus-host relationships shown in the upper right corner: a relationship was newly identified in this study and a viral infection was detected with >70% alignment coverage (coral), a relationship was newly identified in this study but the viral infection was detected with ≤70% alignment coverage (salmon), a relationship was previously reported and the viral infection was also detected in this study (blue), a relationship was previously reported but the viral infection was not detected in this study (light blue), a relationship was unreported so far (white), and a relationship was newly identified in this study but it may be attributed to contamination (gray) (see Discussion). (B and C) Scatterplot between alignment coverages (x axis) and sequence identities with known viruses (y axis). Each dot represents the viral infections identified in this study. Viral infections related to novel virus-host relationships are shown in panel B, and those related to known relationships are shown in panel C. The dot colors correspond to the virus-host relationships shown in panel A. Sequence identity represents the maximum value of the percentage of identical matches obtained by TBLASTX.

