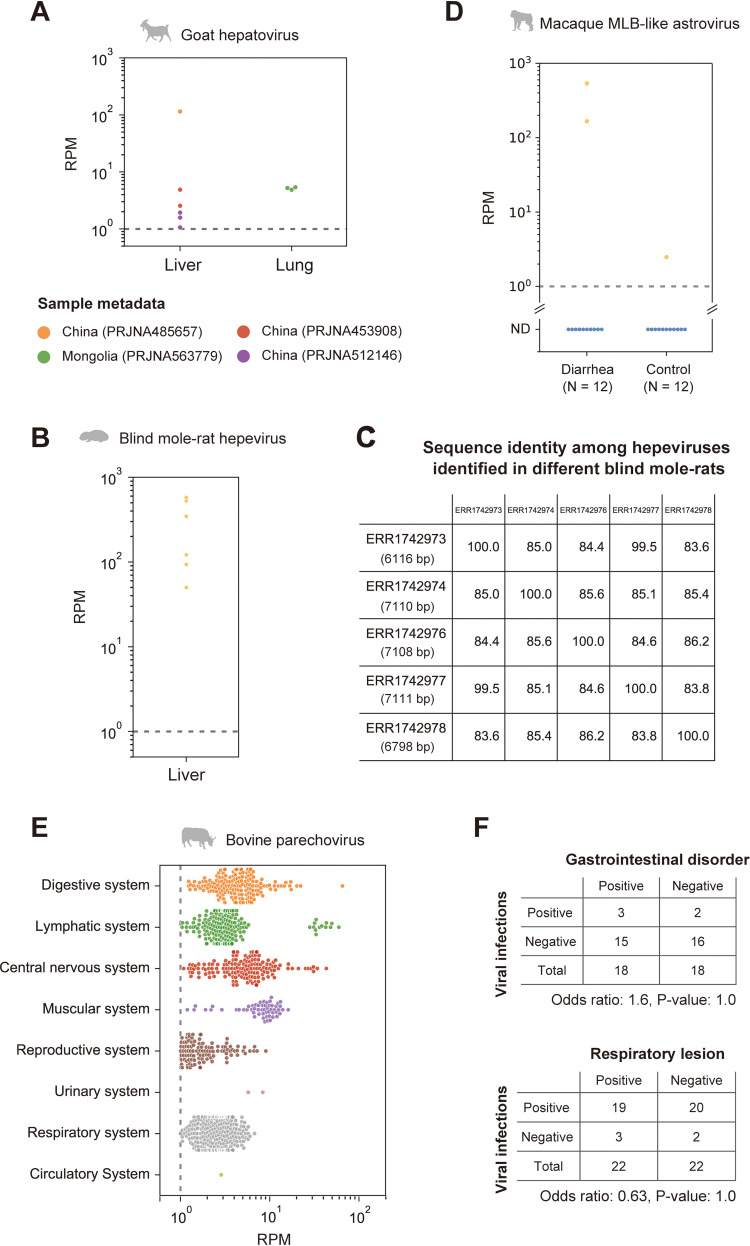
FIG 6.
Detection of viral infections in the natural host population. (A, B, and E) Investigation of viral infections in the natural host population by quantifying viral reads for goat hepatovirus (A), blind mole-rat hepevirus (B), and bovine parechovirus (E). The graph indicates the viral read amount (read per million reads [RPM]) in each tissue or organ system. The gray dotted line indicates the criterion used to determine viral infections (RPM, 1.0). The lower portion of panel A shows the sample metadata. (C) Comparison of nucleotide sequence identities among the hepeviral sequences identified in five different blind mole-rats. The numbers in parentheses in each row are the total number of aligned sites between the viral contigs identified in each individual and the blind mole-rat hepevirus identified in accession no. ERR1742977. (D) Quantification of the macaque MLB-like viral infection levels in the patients with diarrhea and control macaque monkeys. The x axis indicates the diagnosis for the 24 monkeys, and the y axis indicates the RPM. The average RPM for each individual is plotted because six samples were collected from each individual. The dotted line indicates the criterion used for detecting viral infections (RPM, 1.0). We considered samples with RPMs below the criterion as nondetectable (ND). (F) Association between the parechovirus infections and symptoms. The tables show the number of RNA-seq data with and without parechovirus infections in two independent studies, which provide diagnostic information for gastrointestinal disorder (upper panel) and respiratory lesion (lower panel). The odds ratios and P values were obtained by Fisher’s exact test.

