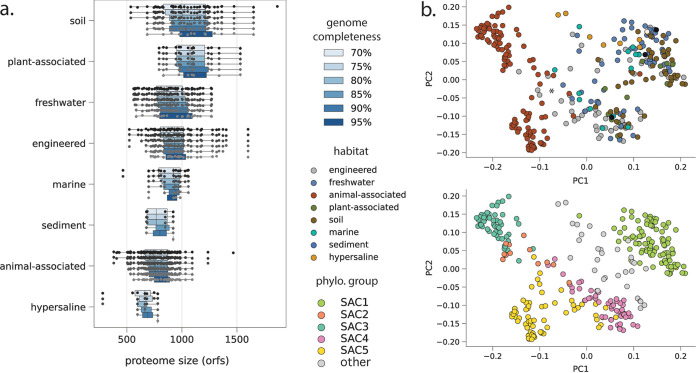
FIG 3.
Proteome characteristics for Saccharibacteria. (a) Predicted proteome size (open reading frame count) at increasing genome completeness thresholds. (b) Overall proteome similarity among Saccharibacteria from different habitat categories (top panel) and phylogenetic clades (bottom panel). PCoAs were computed from presence/absence profiles of all protein clusters with 5 or more member sequences. The primary (PC1) and secondary (PC2) principal coordinates explained 12% and 8% of variance, respectively.

