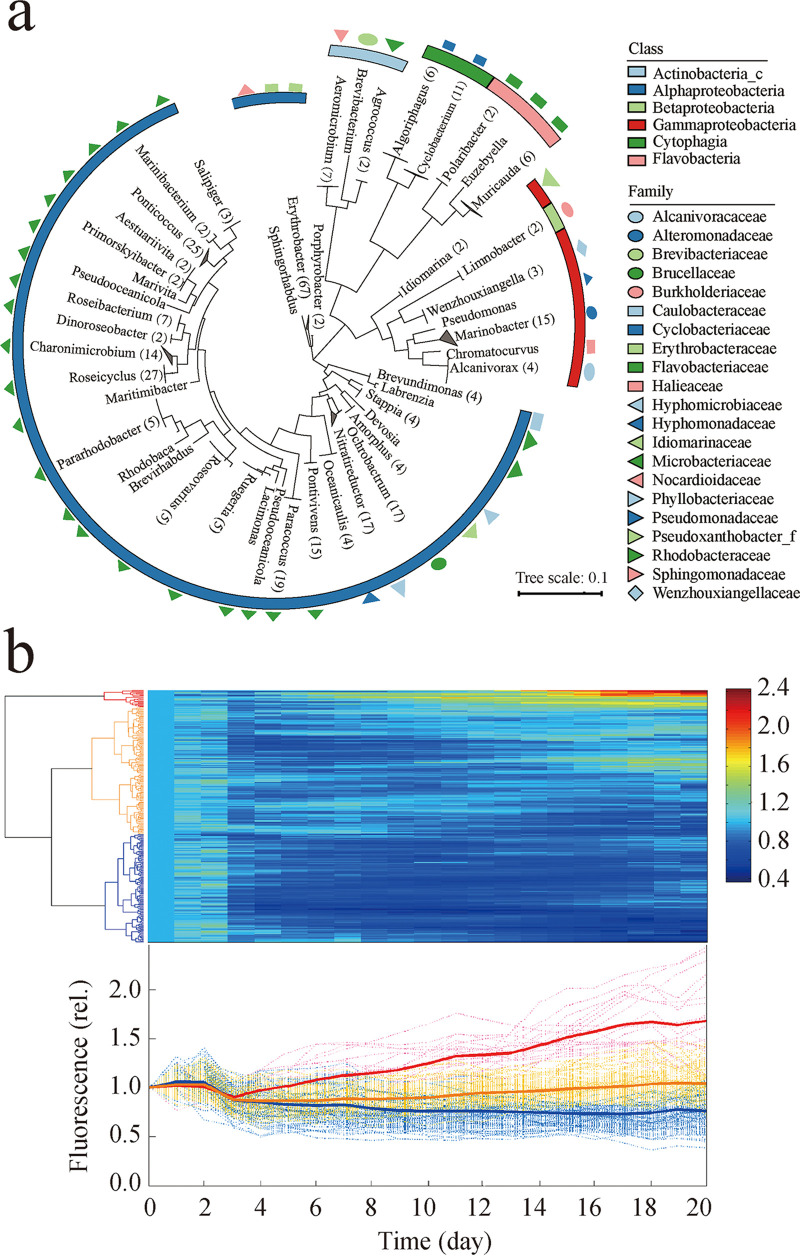
FIG 3.
Classification of 326 bacterial individuals from the antagonism stage and their effect on the growth of Synechococcus sp. PCC7002. (a) Maximum likelihood tree based on 16S rRNA genes. The strains belonging to the same genus were merged into one branch, where the number of strains is shown in parentheses. (b) Effect of each bacterial individual on the growth (using fluorescence as an indicator) of Synechococcus sp. PCC7002. Hierarchical clustering and a heat map were established based on the normalized fluorescence values and normalized fluorescence curves of Synechococcus-bacterium cocultures. These values were normalized against those of the axenic control. A total of 46.0% (150 out of 326) of the bacterial individuals had remarkable negative effects on Synechococcus growth (blue), 26.1% (85 out of 326) promoted the growth of Synechococcus (red), and the others had no obvious effects (yellow).

