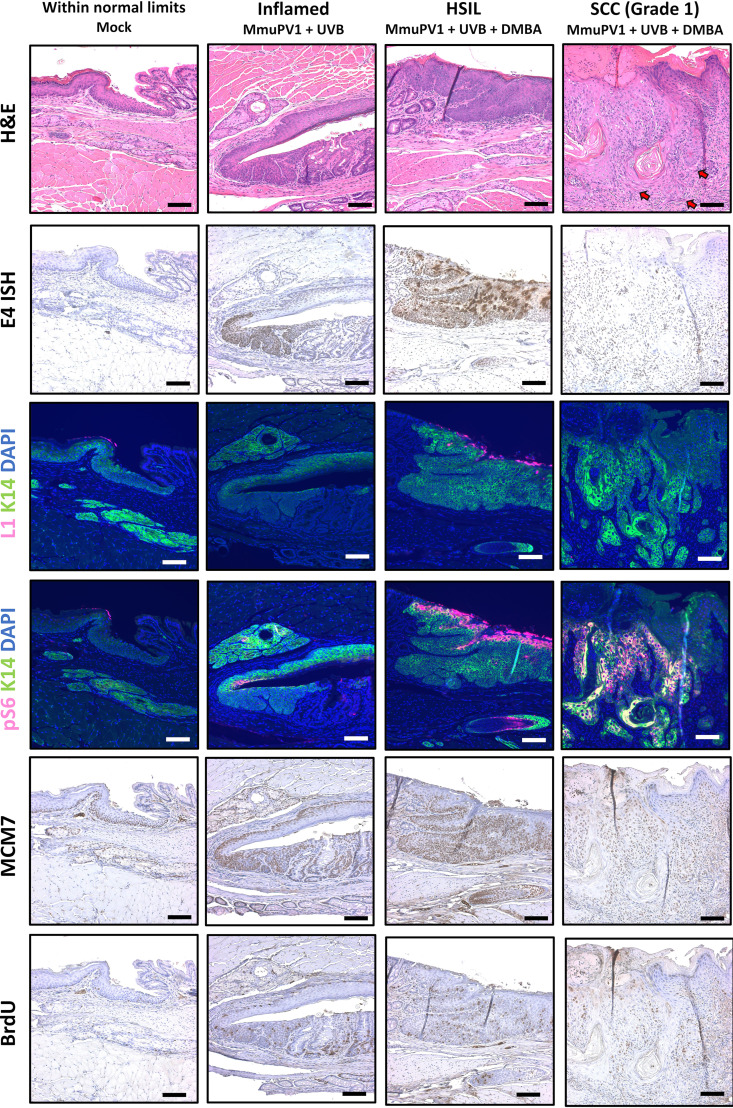
FIG 5.
Biomarker analysis of MmuPV1-infected FVB/NJ mice. Representative tissues were stained for markers of viral infection (E4 RNAScope ISH and L1/K14 IF). Based on H&E staining and E4 RNAScope, the representative tissues shown were selected for further analysis using established biomarkers of papillomavirus-mediated disease (pS6/K14 IF, MCM7 IHC) and proliferation (BrdU IHC). All images show tissues stained in the same experiment and were taken with constant exposure for biomarkers of interest. Red arrows within the H&E image mark areas of invasive carcinoma. Figure S6 shows a higher magnification image of the cancer. All scale bars equal 100 μm.

