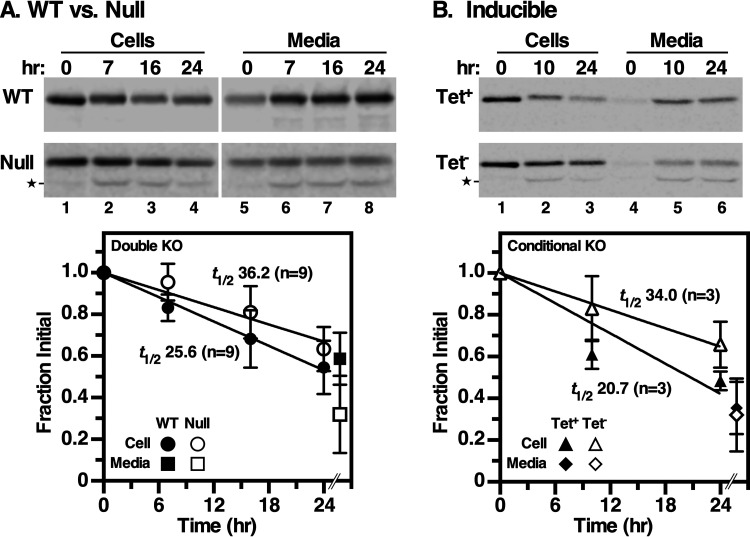
FIG 2.
Turnover of VSG. Wild type versus null (n = 9) (A) and induced (Tet+) versus uninduced (Tet−) cKO (n = 3) (B) cell lines were analyzed by [35S]Met/Cys pulse-chase radiolabeling, and VSG was immunoprecipitated from cell and medium fractions at the indicated times. Precipitates were fractionated by SDS-PAGE and quantified by phosphorimaging (means ± SDs). Only the 24-h medium time point was quantified, and this is offset in the graphs for clarity of presentation; the T0 medium time point was subtracted to zero the data. A proteolytic fragment (star) seen only under GPI-PLC deficiency (null and Tet− cKO) was included in the quantification for these experiments. Half-life times (t1/2; determined by linear regression) are indicated. P value was <0.001 for each set of GPI-PLC replete versus deficient cell lines.

