FIG 4.
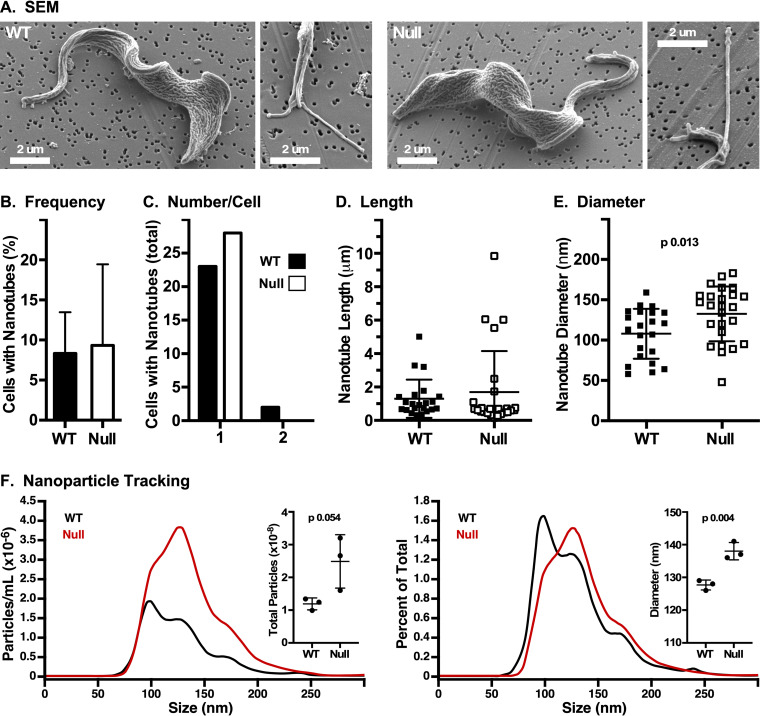
Formation of membrane nanotubes. Wild-type (WT) and GPI-PLC−/− (null) cells were fixed, captured on 0.2-μm filters, and processed for SEM. (A) Representative SEM images of WT and null cells and cells with budding nanotubes. Nanotubes in WT and null cells were quantified for frequency (B), number per cell (C), length (D), and diameter (E) (n = 3, 100 cells per biological replicate). The statistical significance of WT versus null diameter is indicated. (F) Nanoparticle tracking analysis. Representative analyses of number (left) and average size (right) of particles recovered by ultracentrifugation from WT and null conditioned medium (median signal from 10 technical replicates). Inset graphs show quantification of each (mean ± SD, n = 3 biological replicates).

