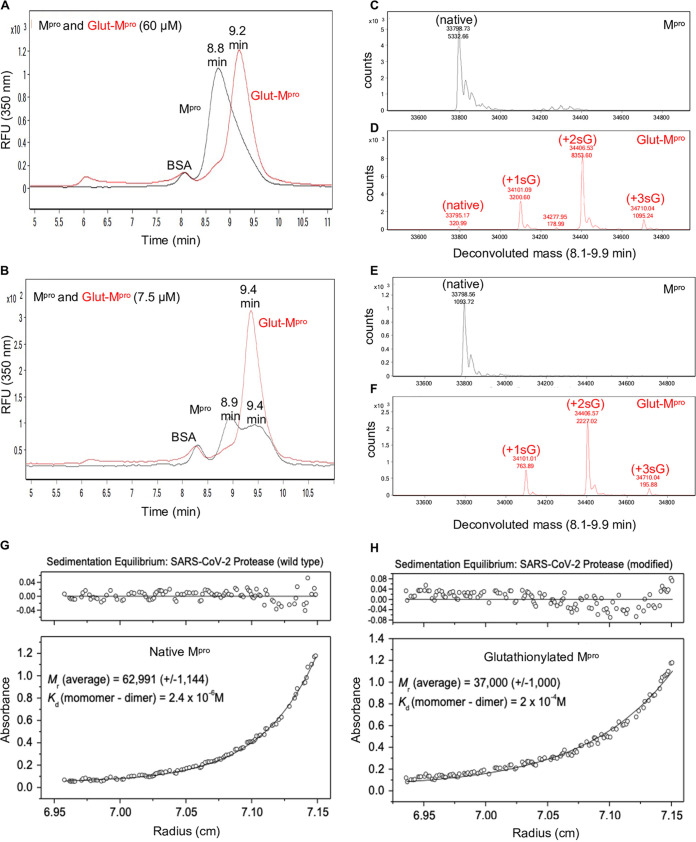
FIG 2.
Glutathionylated Mpro behaves as a monomer based on size exclusion chromatography and equilibrium analytical ultracentrifugation. (A and B) Mpro and glutathionylated Mpro (Glut-Mpro) were analyzed by SEC3000/MALDI-TOF MS, and the eluant was monitored by intrinsic protein fluorescence (in relative fluorescence units [RFU]) (excitation, 276 nm; emission, 350 nm). Glutathionylated Mpro was made with 10 mM GSSG at pH 7.5 for 2 to 2.5 h as described in Materials and Methods. (A and B) Overlay of the chromatograms for 60 μM (each) Mpro (black line) and glutathionylated Mpro (red line) (A) and 7.5 μM (each) Mpro (black line) and glutathionylated Mpro (red line) (B). (C and D) Protein deconvolution profiles for native Mpro (C) and glutathionylated Mpro (D) that were run as shown in panel A. (E and F) Protein deconvolution profile for native Mpro (E) and glutathionylated Mpro (F) that were run as shown in panel D. Shown above each peak are the molecular mass (top number) and the abundance (bottom number) found by protein deconvolution. The earlier eluting peak at 8.5 min is carboxymethylated BSA, which was used as a carrier in the runs of Mpro to help prevent nonspecific losses of Mpro during the run. (G and H) Equilibrium analytical ultracentrifugation of Mpro (G) and glutathionylated Mpro (H) (made as in panel A) at 0.6 mg ml−1 (18 μM) in 50 mM Tris buffer (pH 7.5), 2 mM EDTA, and 100 mM NaCl. The absorbance gradients in the centrifuge cell after the sedimentation equilibrium were attained at 21,000 rpm are shown in the bottom panels. The open circles represent the experimental values, and the solid lines represent the results of fitting to a single ideal species. The best fit for the data shown in panel G yielded a relative molecular weight (Mr) of 62,991 ± 1,144 and a Kd for dimerization of 2.4 μM, and that shown in panel H yielded a molecular weight of 37,000 ± 1,000 and a Kd for dimerization of 200 μM. The corresponding top panels show the differences in the fitted and experimental values as a function of radial position (residuals). The residuals of these fits were random, indicating that the single species model is appropriate for the analyses.

