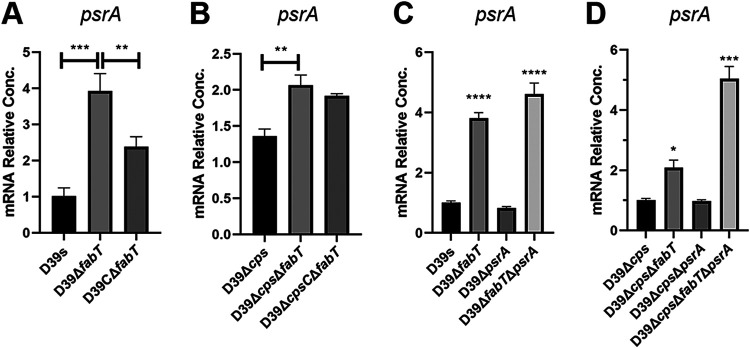
FIG 2.
psrA gene expression in fabT and psrA mutant strains. (A to D) Related abundance of the psrA mRNA in the (A and C) encapsulated and (B and D) unencapsulated fabT and psrA mutant strains was detected by qRT-PCR. Results were normalized to gyrB. Data are shown as the mean ± SEM of a representative experiment. Each experiment was replicated at least three times. Statistical analysis was performed using the unpaired t test. *, P < 0.05; **, P < 0.01; ***, P < 0.001; ****, P < 0.0005.

