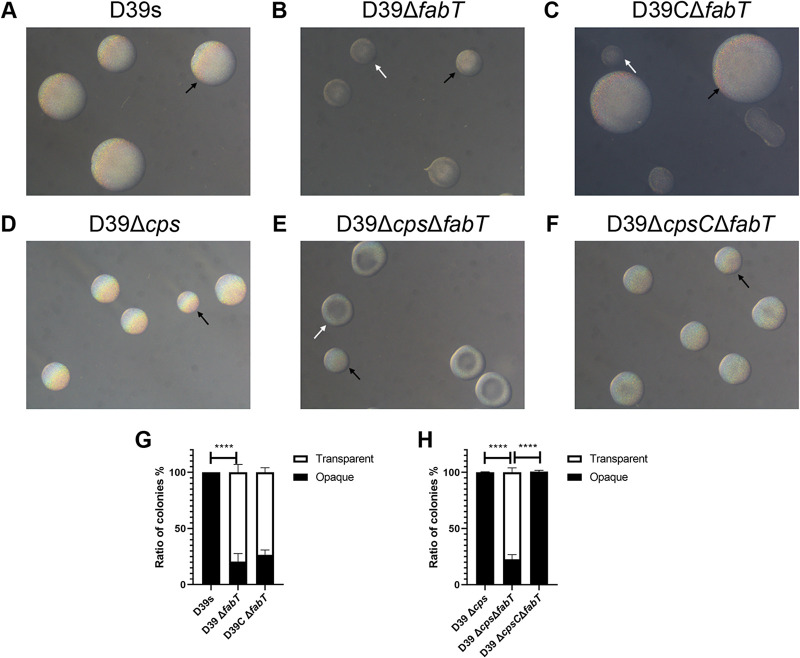
FIG 3.
Colony morphology of fabT mutants. (A to C) Encapsulated D39 and derivatives and (D to F) unencapsulated D39Δcps and derivatives were grown on TSA plates supplemented with catalase. Phase variation of colony opacity of S. pneumoniae was visualized under an inverted microscope through oblique lighting after 24 h (encapsulated) and 26 h (unencapsulated). Representative opaque (O) and transparent (T) colonies in each strain are highlighted with black and white arrowheads, respectively. (G) O/T ratio of encapsulated strains. (H) O/T ratio of unencapsulated strains. All pictures are to the same scale. Original magnification = ×40.

