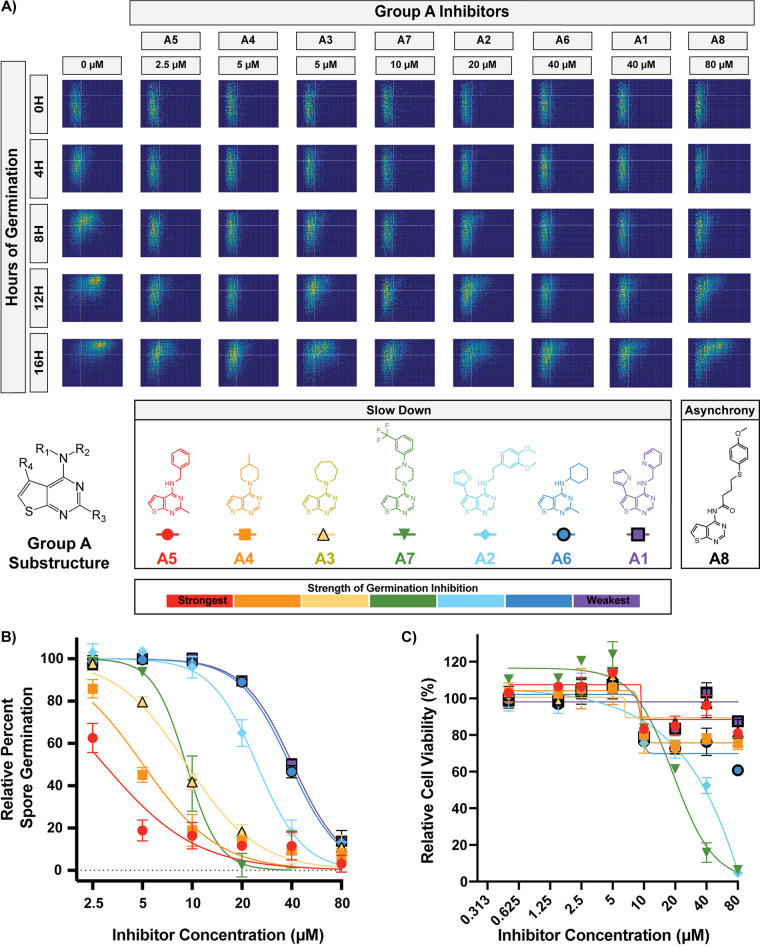
FIG 4.
All but one group A compound caused the slow-down phenotype. (A) Germination profiles of ∼6,000 spores in the presence of group A compounds at phenotypic concentrations. (B) Dose-response curves of compounds A1 to A7 at concentrations from 2.5 to 80 μM (error bars represent standard deviations determined from 6 fields of view from 2 independent replicates). Data points for inhibitors that precipitated at higher concentrations were excluded. (C) Dose-response curves showing levels of cytotoxicity against human fibroblasts (error bars represent standard deviations from 2 independent replicates).

