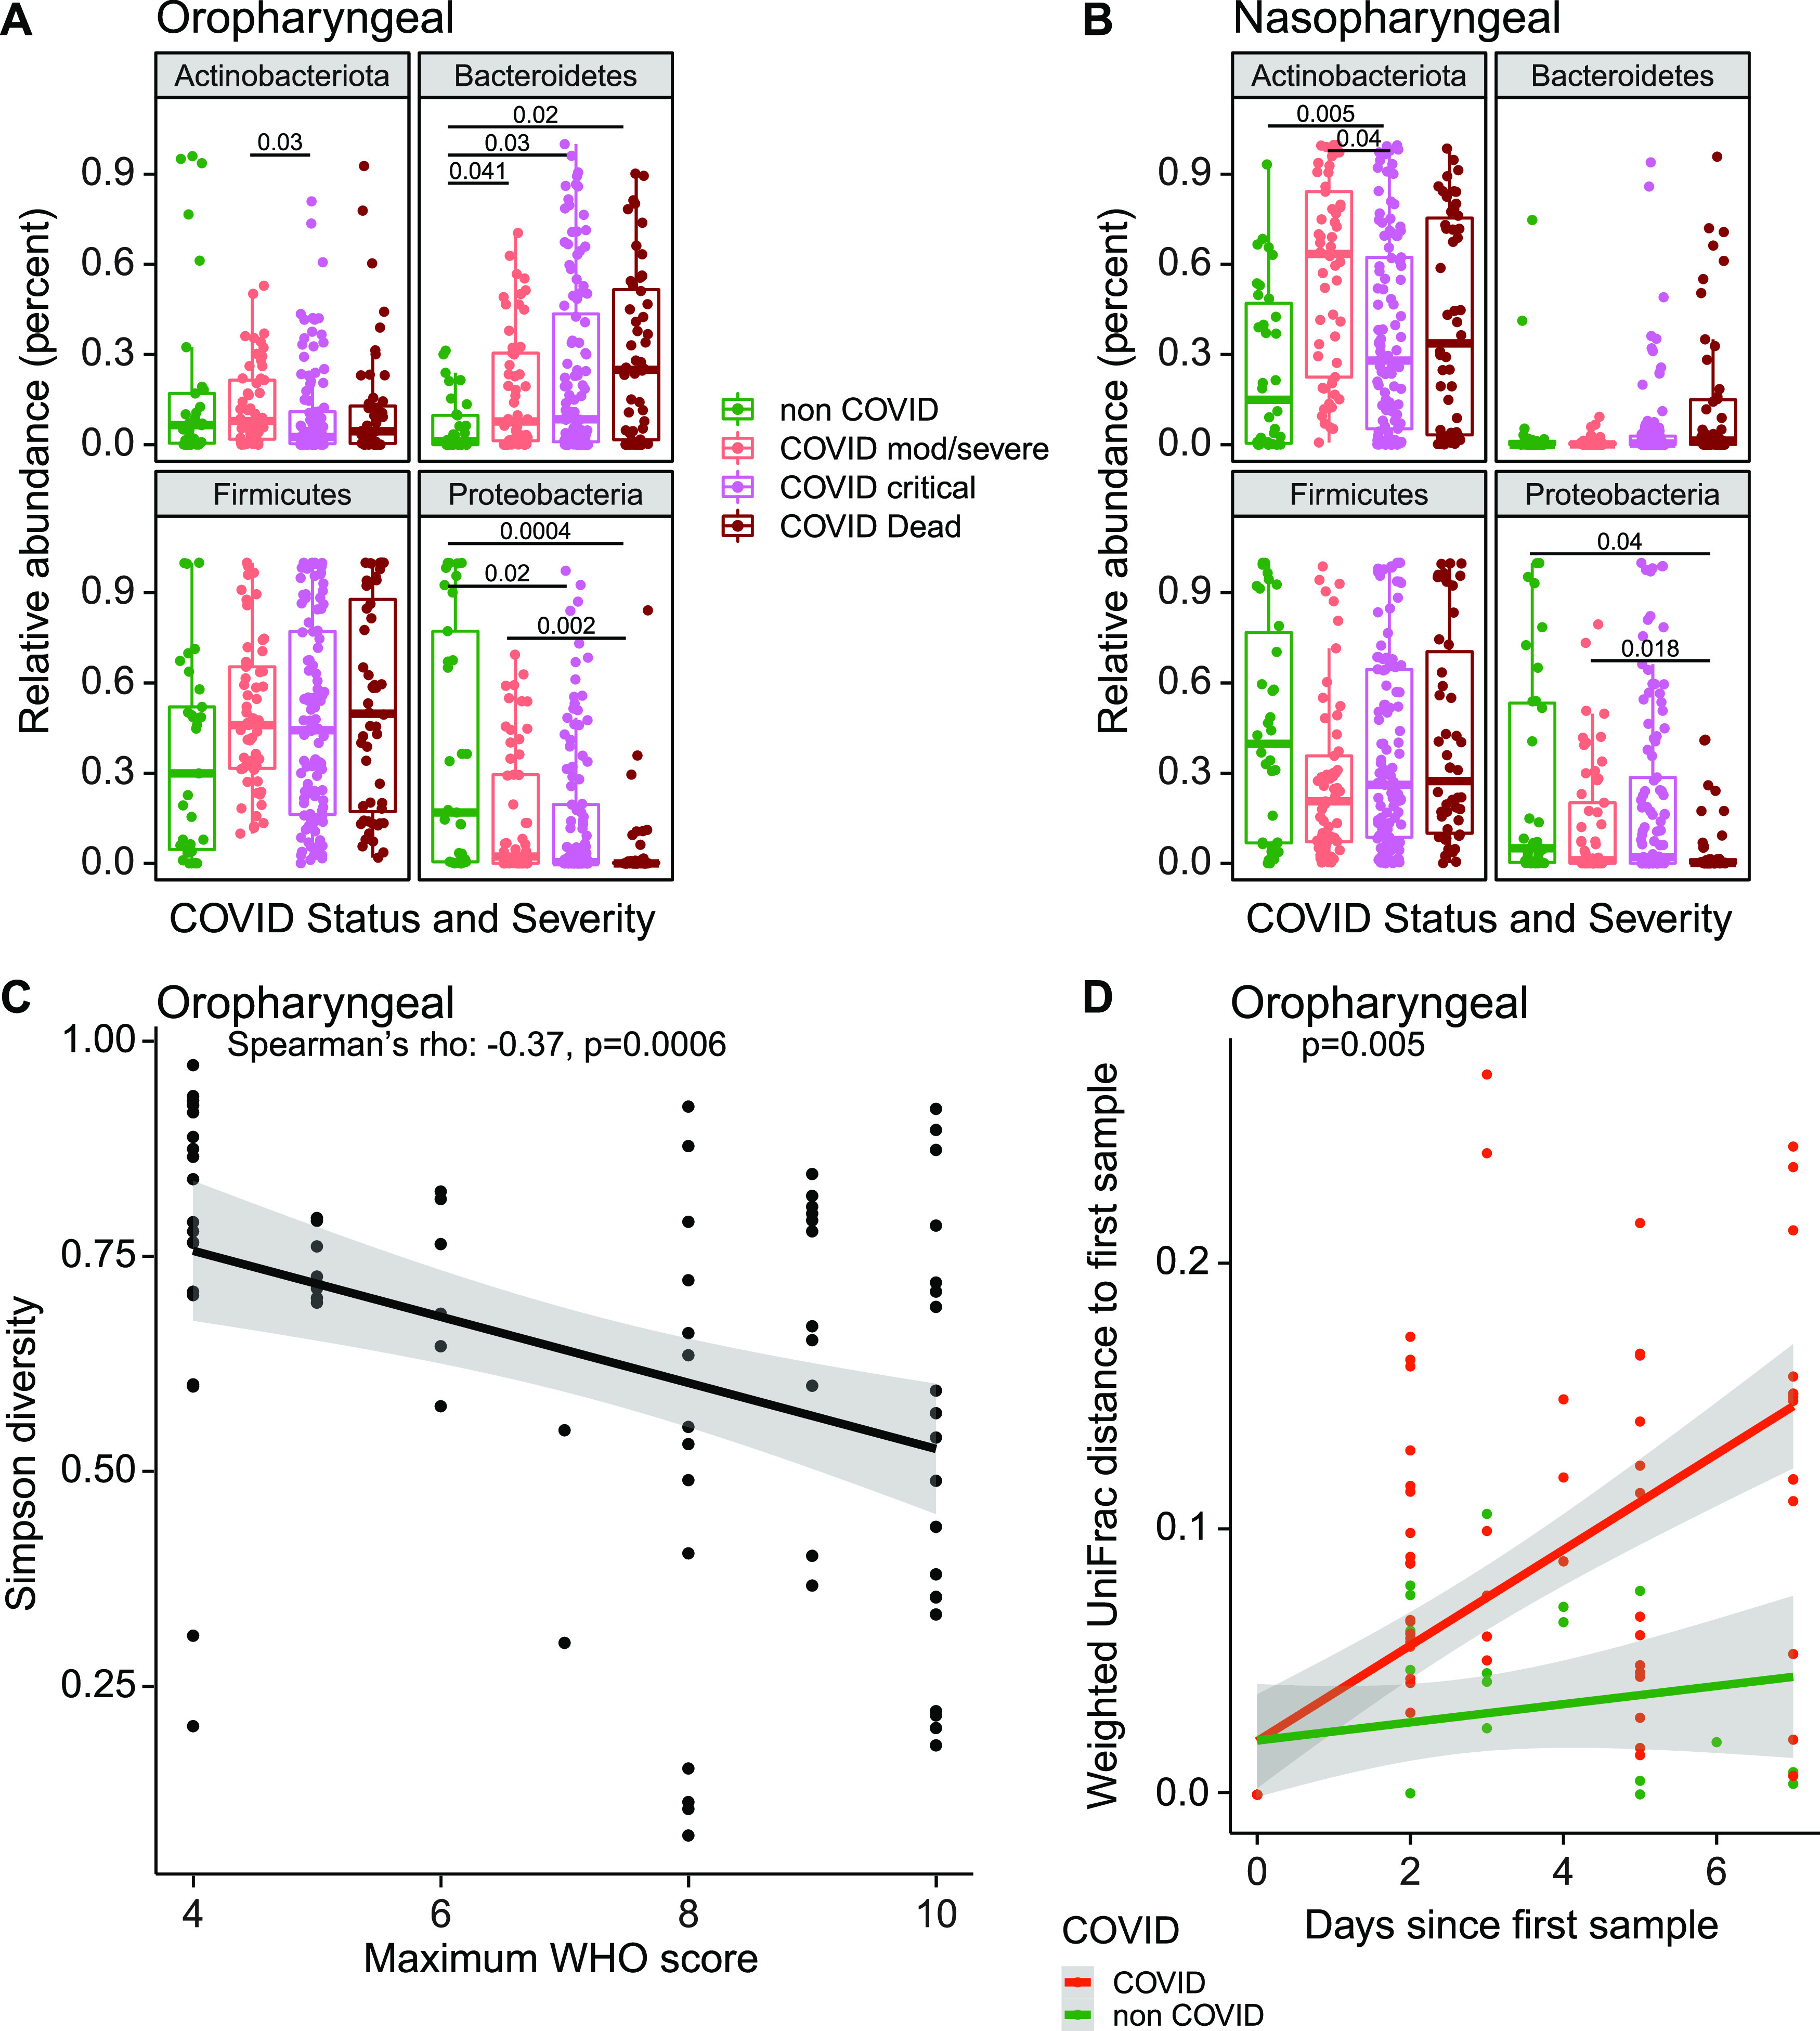
FIG 2.

Signatures of disease severity in airway bacterial populations. (A and B) Relative abundances of bacterial phyla, by patient disease status categories. Values for all samples are shown; P values were generated using random subsampling for each subject and indicate Wilcoxon pairwise comparisons. (C) Maximum WHO score reached by each patient (x axis) versus Simpson diversity index in the first oropharyngeal sample obtained for each subject (y axis). The gray shading shows the 95% confidence interval. (D) Divergence in oral bacterial communities over time, comparing COVID-19 (red) and non-COVID (green) samples. The x axis shows the time since the first sample; the y axis shows the weighted UniFrac distance to the first sample. The gray shading shows the 95% confidence interval.
