
FIG 5.
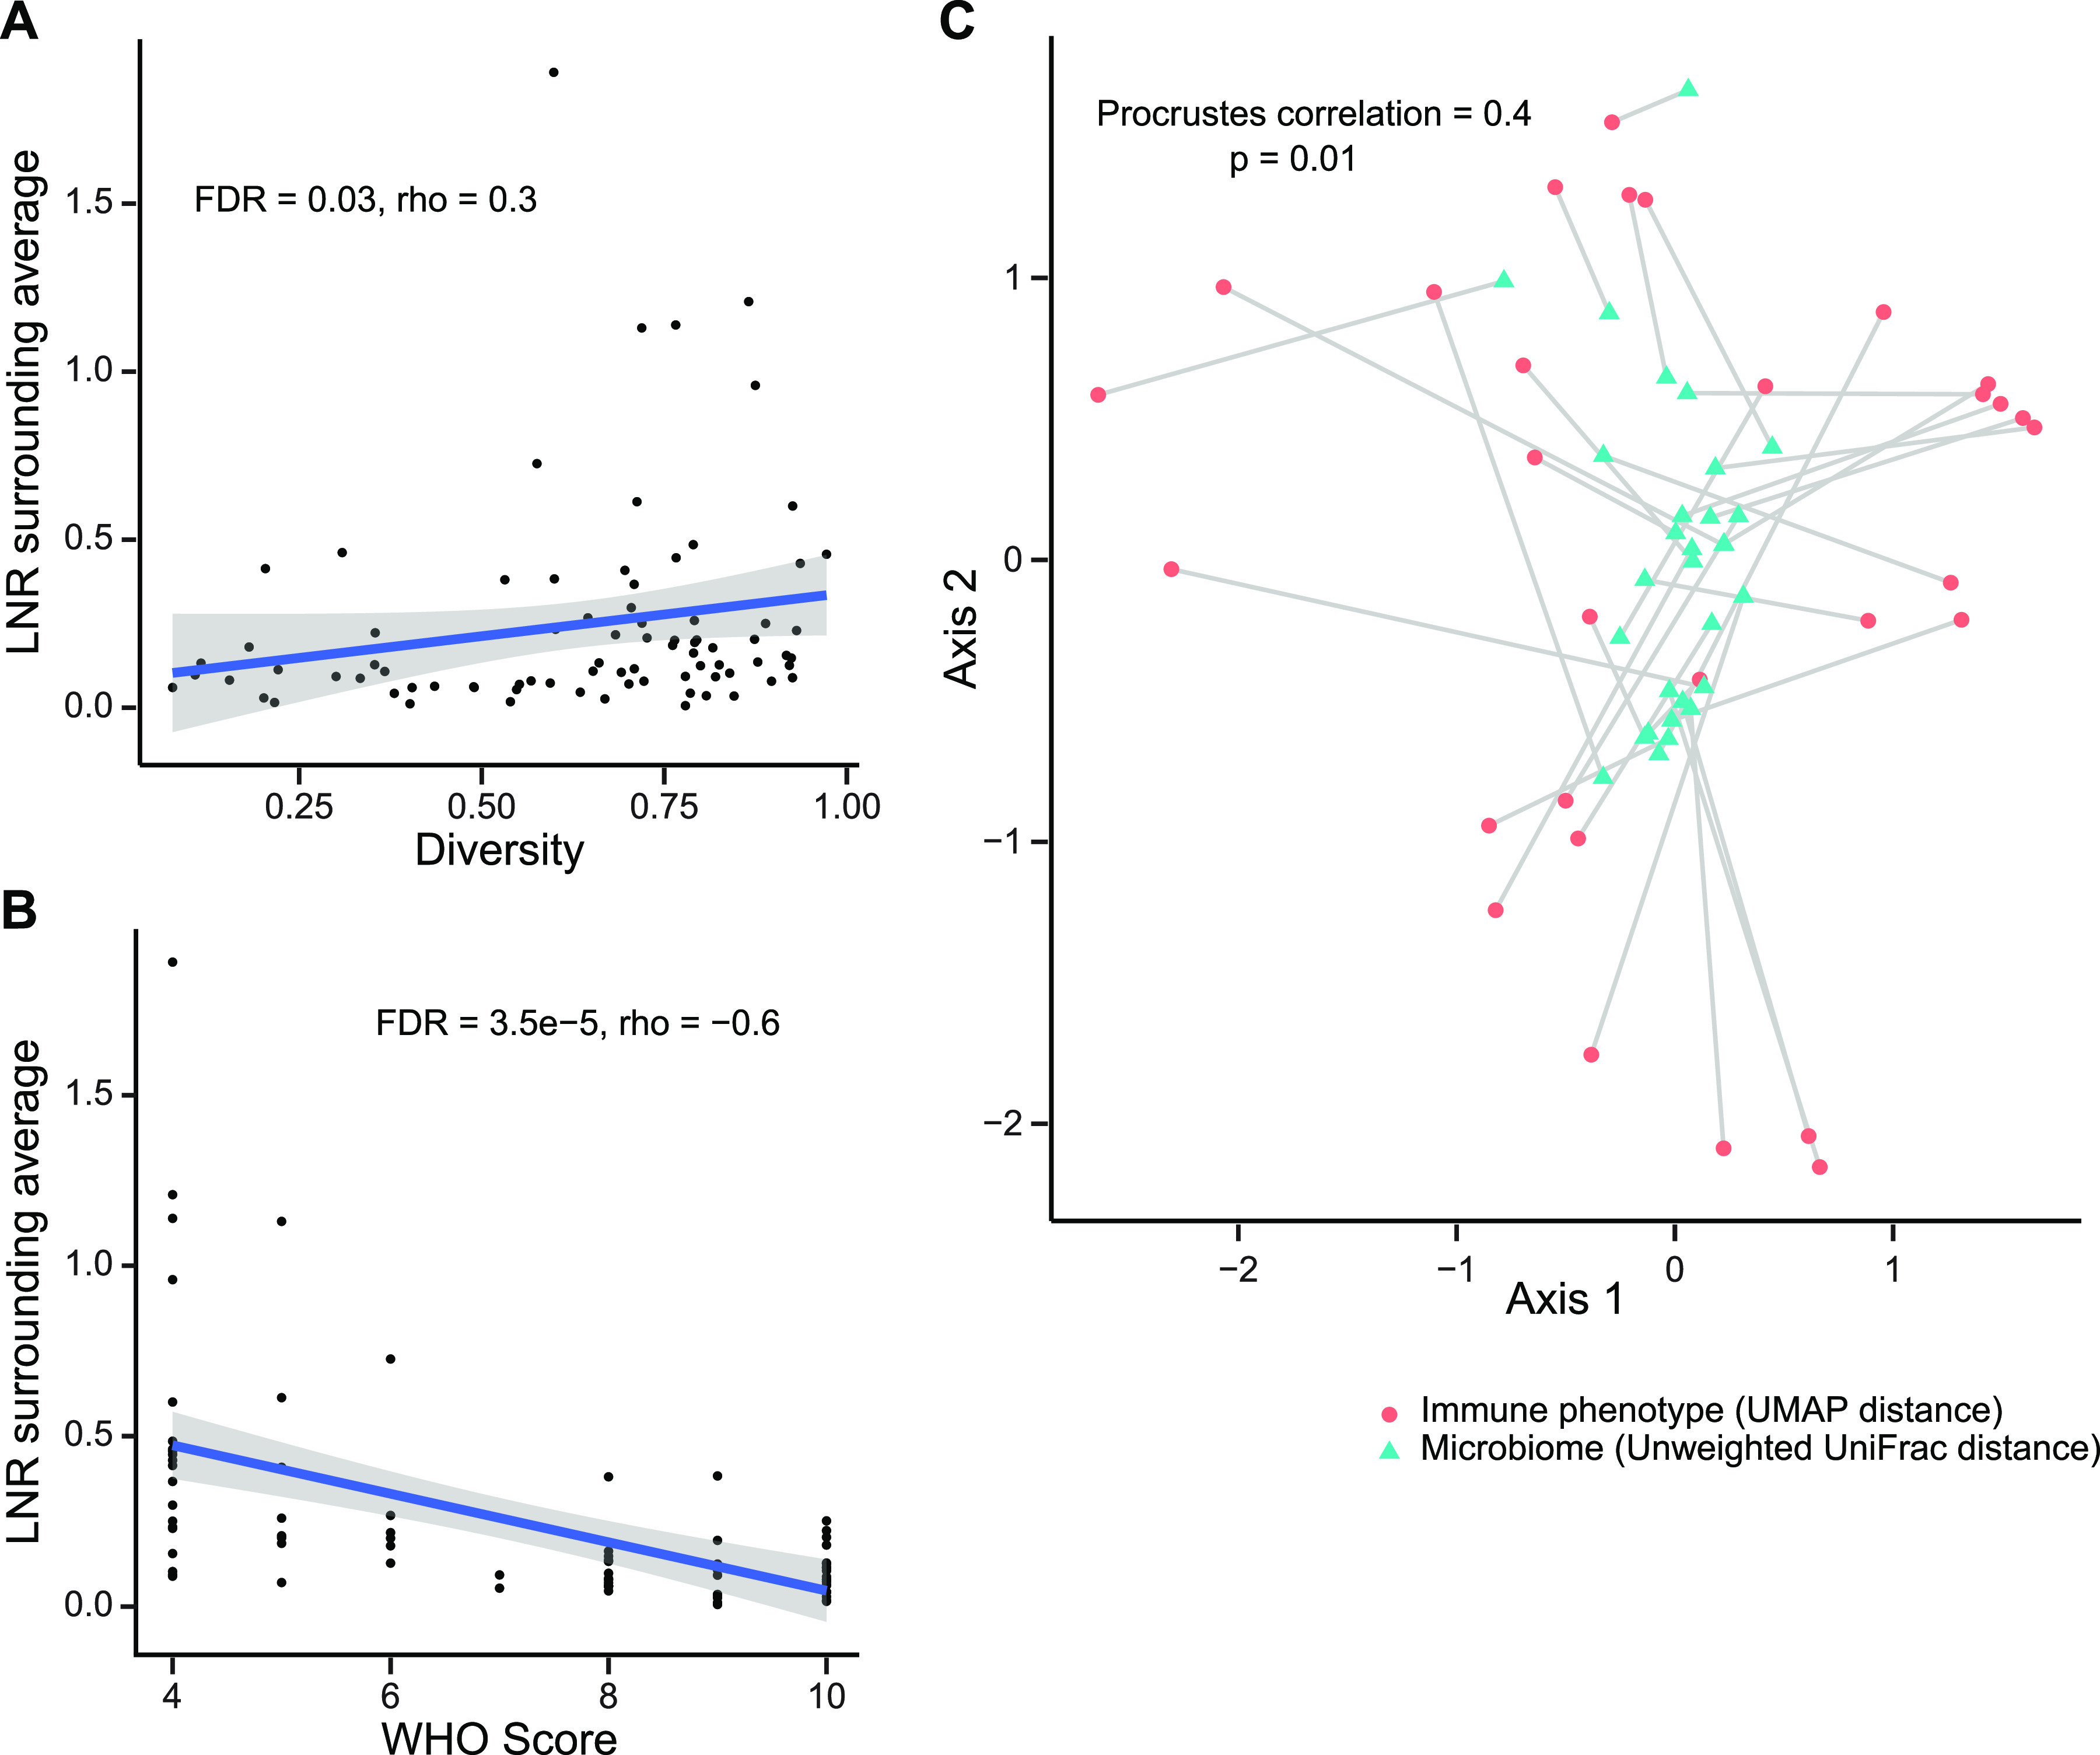
Relationship between oropharyngeal microbiome communities and systemic immune features. (A) Oropharyngeal microbiome diversity at the first time point sampled is plotted against the blood lymphocyte/neutrophil ratio (LNR) at the time of sampling. (B) Blood lymphocyte/neutrophil ratio at time of oropharyngeal sampling (from panel A) is plotted against maximum WHO score during hospitalization. (C) Procrustes analysis in which the UMAP immune profile plot and unweighted UniFrac microbiome plot are overlaid. The immune and microbiome profiles from individual subjects are connected by a line.