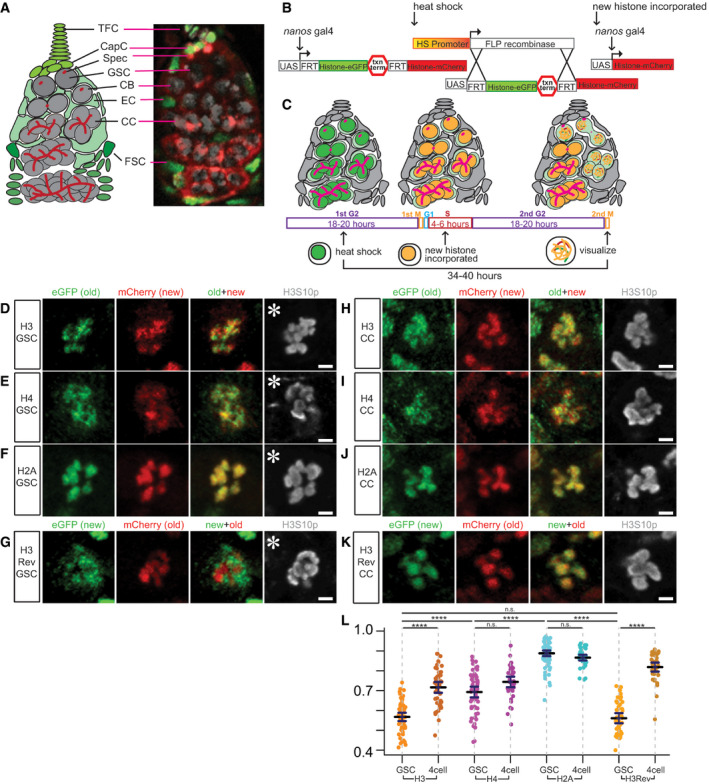
Figure 1. Non‐overlapping old versus new histone H3 distribution patterns in mitotic Drosophila female germline stem cells (GSCs), but not in cystocytes (CCs).

-
AA cartoon and corresponding immunofluorescence image depicting the Drosophila germarium. Terminal filament cells (TFC) and cap cells (CapC) create a niche for female germline stem cells (GSC), which divide asymmetrically to self‐renew and produce a cystoblast (CB). The CB undergoes four mitotic divisions to create differentiating cystocytes (CC). The germline (gray) is supported by somatic (green) escort cells (EC) and follicle stem cells (FSC) that produce follicle cells that surround developing egg chambers. The spectrosome (Spec, red) is a specialized organelle in the early‐stage germline, such as GSCs and CBs. The spectrosome structure is round while the fusome is branched, which occurs over the mitotic divisions in further differentiated germ cells, connecting the CCs within a cyst.
-
BA cartoon detailing how the heat shock‐controlled dual‐color system driven by GreenEye‐nanos‐Gal4 labels pre‐existing (old) histones with eGFP (green fluorescent protein) and newly synthesized (new) histones with mCherry (red fluorescent protein), respectively.
-
CA scheme of recovery time and histone incorporation after heat shock that induces an irreversible genetic switch in the histone transgene.
-
D–FOld (green) versus new (red) histone patterns for H3 (D), H4 (E), and H2A (F) in prometaphase female GSCs marked by anti‐H3S10p (gray).
-
GOld (red) versus new (green) histone patterns for H3Rev in prometaphase female GSCs marked by anti‐H3S10p (gray).
-
H–JOld (green) versus new (red) histone patterns for H3 (H), H4 (I), and H2A (J) in prometaphase female 4‐cell CCs marked by anti‐H3S10p (gray).
-
KOld (red) versus new (green) histone patterns for H3Rev in prometaphase female 4‐cell CC marked by anti‐H3S10p (gray).
-
LQuantification of overlap between old and new histones in late prophase and prometaphase GSCs and CCs using Spearman correlation: The measurement is from a single Z‐slice at the center of each mitotic nucleus, which shows results similar to analyzing every Z‐slice throughout the entire Z‐stack and averaging them (Fig EV2A, see Materials and Methods). Data were collected over 20, 16, 11, and 12 separate experiments for H3, H4, H2A, and H3Rev, respectively. Values are mean ± 95% CI. P‐value: pairwise ANOVA test with Bonferroni correction. ****: P < 0.0001, n.s.: not significant.
Data information: Asterisk: niche. Scale bars: 2 µm. See Dataset EV1 for individual data points for Fig 1L.
