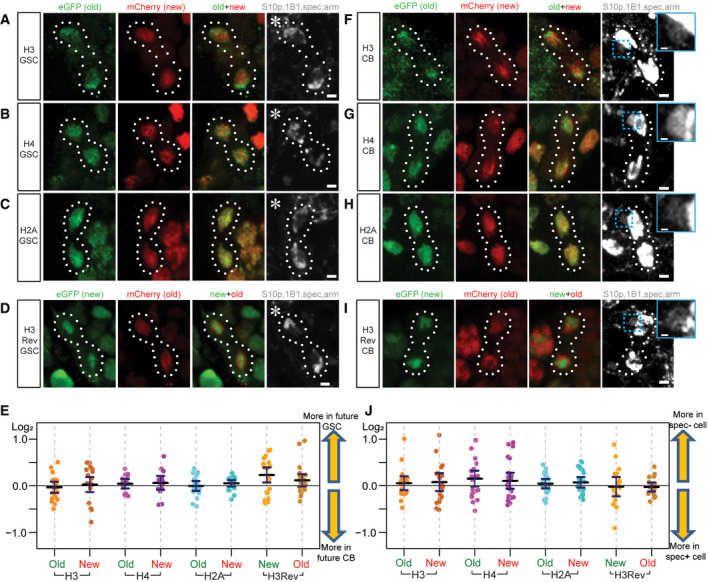
Figure 2. Mitotic GSCs and CBs exhibit non‐overlapping old versus new histone H3 distribution patterns, but overall symmetric old and new histone segregation patterns.

-
A–CTelophase GSCs marked by H3S10p (gray) expressing old (green) and new (red) histone H3 show non‐overlapping patterns (A). Telophase GSCs expressing old (green) and new (red) histone H4 show moderate levels of overlap (B). GSCs expressing old (green) and new (red) histone H2A show high levels of overlap (C).
-
DA H3Rev control where the old and new fluorescent tags have been switched shows the non‐overlapping patterns of old (red) versus new (green) histone H3 in telophase GSCs marked by H3S10p (gray).
-
EQuantification of log2 ratios of total old and new histone inherited by each future daughter cell of the GSC division, where a value of 0 is equal inheritance at exactly a 1:1 ratio. Data gathered over 16 separate experiments for H3 GSCs. Data gathered over 9 separate experiments for H4 GSCs, H2A GSCs, and H3Rev GSCs. Values are mean ± 95% CI.
-
F–HTelophase CBs marked by H3S10p (gray) expressing old (green) and new (red) histone H3 also show non‐overlapping patterns (F). Telophase CBs expressing old (green) and new (red) histone H4 (G) and H2A (H), which depict more overlap like their patterns in GSCs.
-
IA H3Rev control with switched old and new fluorescent tags shows the non‐overlapping old (red) versus new (green) histone H3 patterns in telophase CBs marked by H3S10p (gray).
-
JQuantification of log2 ratios of total old and new histone inherited by each future daughter cell of the CB division, where a value of 0 is equal inheritance at exactly a 1:1 ratio. Data gathered over 12 separate experiments for H3 CBs and H4 CBs. Data gathered over 9 separate experiments for H2A CBs and H3Rev CBs. Values are mean ± 95% CI.
Data information: Asterisk: niche. Scale bars: 2 µm. Dashed box (cyan): biased spec inheritance. Zoomed‐in images of biased spectrosome inheritance (gray) are displayed to the right of panels (F‐I). Scale bars: 0.5 µm. See Dataset EV2 for individual data points for Fig 2E and J.
