
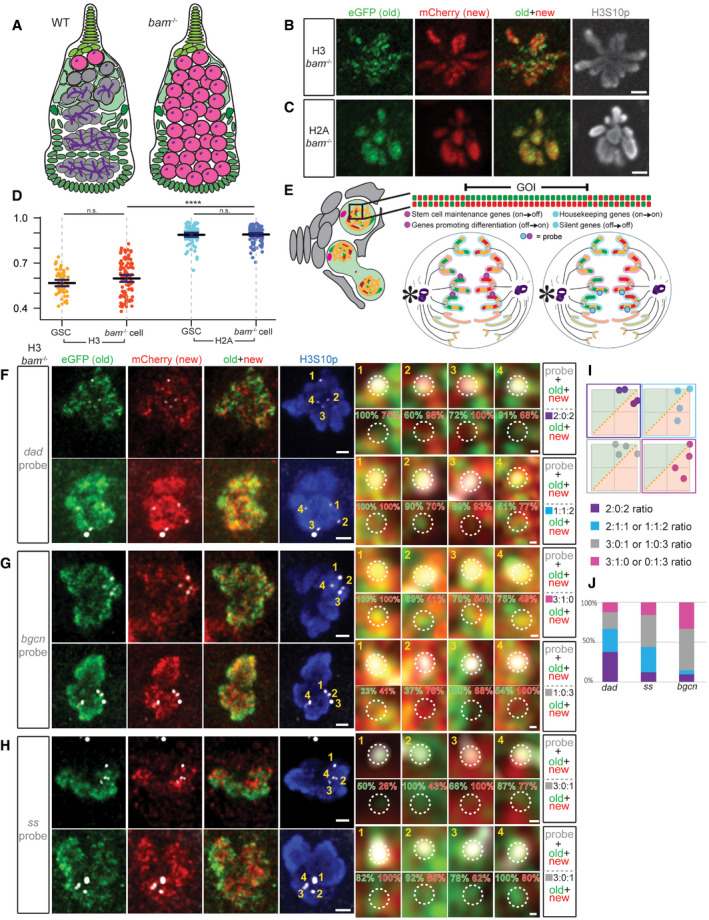
Figure 3. bam mutant germ cells recapitulate the separable old versus new H3 distribution in WT GSCs, and Oligopaint IF‐FISH reveals distinct old versus new H3 at key genes.
-
AA cartoon depicting a WT germarium with differentiating germline at different stages (gray) compared with a bam mutant ovariole filled with GSC‐like cells (pink) without further differentiated germ cells. Undifferentiated cells can be identified by the presence of dotted spectrosome versus branched fusome structure (purple).
-
B, CNon‐overlapping patterns of old (green) versus new (red) histone H3 (B) and overlapping patterns for H2A (C) in mitotic prometaphase bam mutant cells marked by anti‐H3S10p (gray), similar to WT GSCs. Scale bars: 2 µm.
-
DQuantification of the overlap between old and new histones in late prophase and prometaphase bam mutant cells using Spearman correlation, also plotted with and compared to the WT GSC values from Fig 1L. Data gathered over 4 separate experiments. Values are mean ± 95% CI. P‐value: pairwise ANOVA test with Bonferroni correction. ****: P < 0.0001. n.s.: not significant.
-
EA cartoon depicting the Oligopaint IF‐FISH scheme to identify old versus new histone inheritance at single genomic loci in mitotic cells. (Left) A germarium containing a GSC in prometaphase, where the 3D chromatin structure may disguise local asymmetries at genomic regions of interest. (Top) A linearized gene of interest (GOI) displays local asymmetries. (Bottom) Two anaphase cells depict potential Oligopaint IF‐FISH results. Maternal chromosomes are outlined in pink and paternal ones in blue. (Bottom Left) Probes recognize genes (magenta) that change their epigenetic state in a 2:2 ratio with biased old:new H3‐enriched regions. In this instance, each duplicated sister chromatid from either maternal or paternal chromosome has an “agreement” on old (green, inherited by GSC, niche is indicated by an asterisk) versus new (red, inherited by the CB) H3. (Bottom Right) Probes recognize genes (cyan) that maintain their epigenetic state associated with more symmetric regions (yellow) that do not have a strong bias for either old or new H3.
-
F–HExamples showing old (green) versus new (red) H3 distribution patterns and percentage of signal strength at a single genomic locus labeled with fluorescent probes (gray) for the dad gene (F), bgcn gene (G), and ss gene (H) in bam mutant GSC‐like cells at prometaphase marked by anti‐H3S10p (blue). Scale bars: 1 µm. Zoomed‐in images of each probe are displayed to the right of each figure panel. Scale bars: 0.1 µm.
-
IExamples of scatter plots showing probes' association with normalized old H3 (green, above X = Y line) versus new H3 (red, below X = Y line) and the (i):(ii):(iii) ratios that result from them, where (i) is the number of FISH signals more associated with old histone, (ii) is the number of FISH signals that had equal association with both old and new histones, and (iii) is the number of FISH signals more associated with new histone.
-
JQuantification of the probe association ratios with old versus new H3 for each candidate gene in bam mutant germ cells. Data gathered over 4 separate experiments for dad, 3 for bgcn, and 2 for ss.
Data information: See Dataset EV3a for individual data points for Fig 3D and Dataset EV3b for individual data points for Fig 3J.