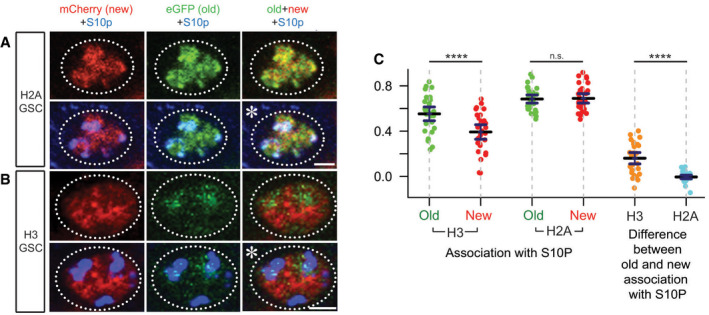
Spearman correlation quantification of overlap between old histone signal and H3S10p (green dots) and new histone signal and H3S10p (red dots) shows a significant difference in H3 GSCs (
n = 30, mean = 0.553 for old and 0.392 for new) but not H2A GSCs (
n = 31, mean = 0.684 for old and 0.689 for new). For each GSC, the Spearman value for old histone associated with H3S10p was subtracted from the Spearman value for new histone associated with H3S10p to quantify the magnitude of difference for each individual cell (right side). There was a significant difference in the amount of old versus new H3 associated with H3S10p (orange dots, mean = 0.160) compared to the amount of old versus new H2A associated with H3S10p (blue dots, mean = −0.006). Data collected over 7 separate experiments. Values are mean ± 95% CI.
P‐value: pairwise ANOVA test with Bonferroni correction. ****
P < 0.0001. n.s.: not significant. See Dataset
EV6 for individual data points.

