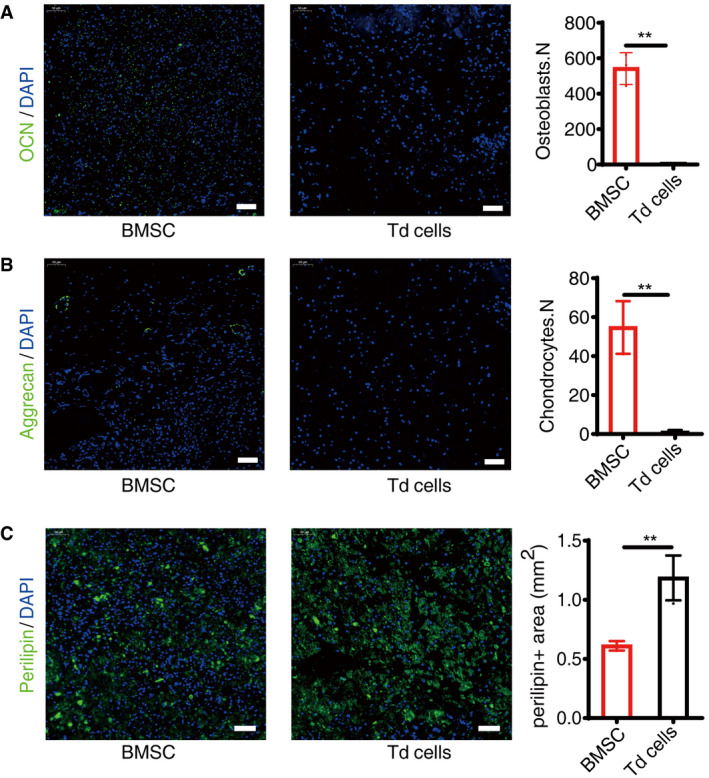
Figure EV2. Adipogenic, osteogenic, and chondrogenic differentiation analysis in vivo .

- Immunofluorescence staining of OCN and statistical analyses of BMSCs and tdTomato+ cells (Td cells), scale bar = 50 µm. Images are representative of five independent biological replicates, n = 6 independent microscopic vision fields in the right panel. Data were compared using an unpaired t‐test (** indicates P < 0.01), and error bars are standard deviations.
- Immunofluorescence staining of Aggrecan and statistical analyses of positive cells, scale bar = 50 µm. Images are representative of five independent biological replicates, n = 6 independent microscopic vision fields in the right panel. Data were compared using an unpaired t‐test (** indicates P < 0.01), and error bars are standard deviations.
- Immunofluorescence staining of Perilipin and statistical analyses of positive cells, scale bar = 50 µm. Images are representative of five independent biological replicates, n = 6 independent microscopic vision fields in the right panel. Data were compared using an unpaired t‐test (** indicates P < 0.01), and error bars are standard deviations.
