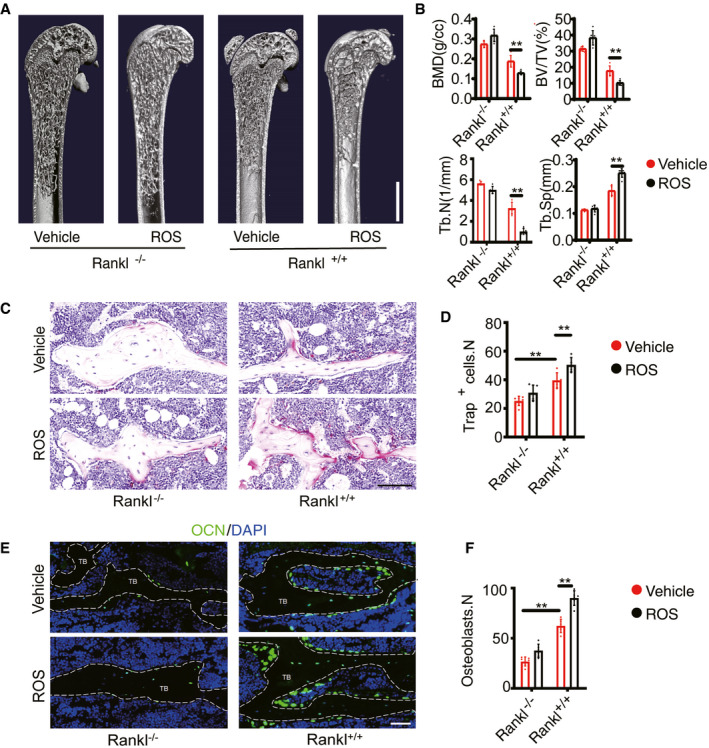
Figure 6. RANKL knockout from BM adipose lineage cells mediates rosiglitazone‐induced bone loss.

-
A, BThree‐dimensional CT analyses of BMD, BV/TV, Tb.N, and Tb.Sp in trabecular bone from Vehicle (n = 5 independent biological replicates) and ROS (n = 6 independent biological replicates) model of AdipoqCre; ranklfl/fl (Rankl −/−) and ranklfl/fl (Rankl +/+) mice. Scale bar = 1 mm. Data were compared using an unpaired t‐test (** indicates P < 0.01), and error bars are standard deviations.
-
C, DTRAP staining and statistical analyses of numbers of osteoclasts in the trabecular bone from vehicle (n = 6 and 5 independent biological replicates) and ROS (n = 6 and 6 independent biological replicates) treatment. Scale bar = 100 µm. Data were compared using an unpaired t‐test (** indicates P < 0.01), and error bars are standard deviations. n = 5 independent microscopic vision fields in (D).
-
E, FOCN staining and statistical analyses of the number of osteoblasts in femurs from vehicle (n = 6 and 5 independent biological replicates) and ROS (n = 6 and 6 independent biological replicates) treatment. Scale bar = 50 µm. TB: trabecular bone. Data were compared using an unpaired t‐test (** indicates P < 0.01), and error bars are standard deviations. n = 5 independent microscopic vision fields in (F).
