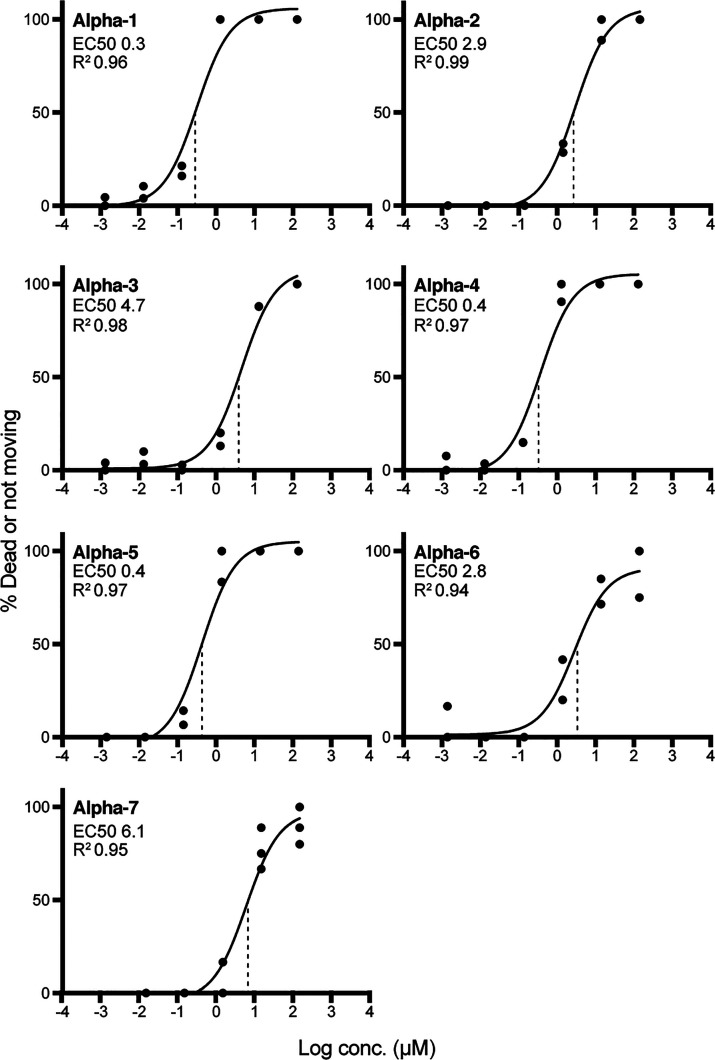
Figure 4.
Effect of α-nemertides in the Artemia microwell assay. 1, 4, and 5 have EC50 values in the range 0.3–0.4 μM. 2, 3, 6, and 7 have average EC50 values in the range 2.8–6.1 μM. All experiments were performed in duplicate, except 7, which was done in triplicate. All data points are shown in the graphs (dots), with average fitted values plotted as a line. Vertical dotted lines display the EC50s.

