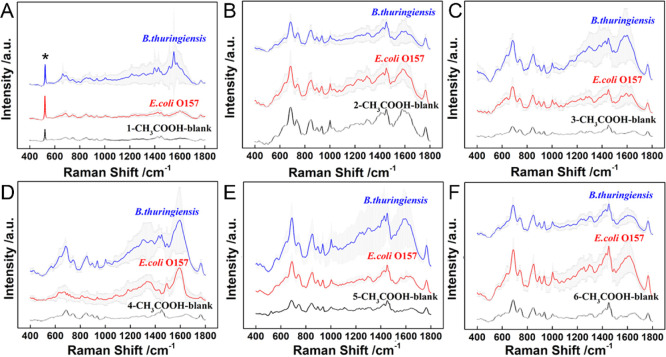
Figure 2.
Mean average SERS spectra of blank and bacteria with different layers after (A–F) acetic acid treatment. (A) NL = 1, (B) NL = 2, (C) NL = 3, (D) NL = 4, (E) NL = 5, and (F) NL = 6. Gray color shows the error bar of each spectra. The error bar is based on three spectra, namely, three individual bacteria were tested and each bacterium was measured to generate one SERS spectra. The peak marked with * indicates the Si peak.

