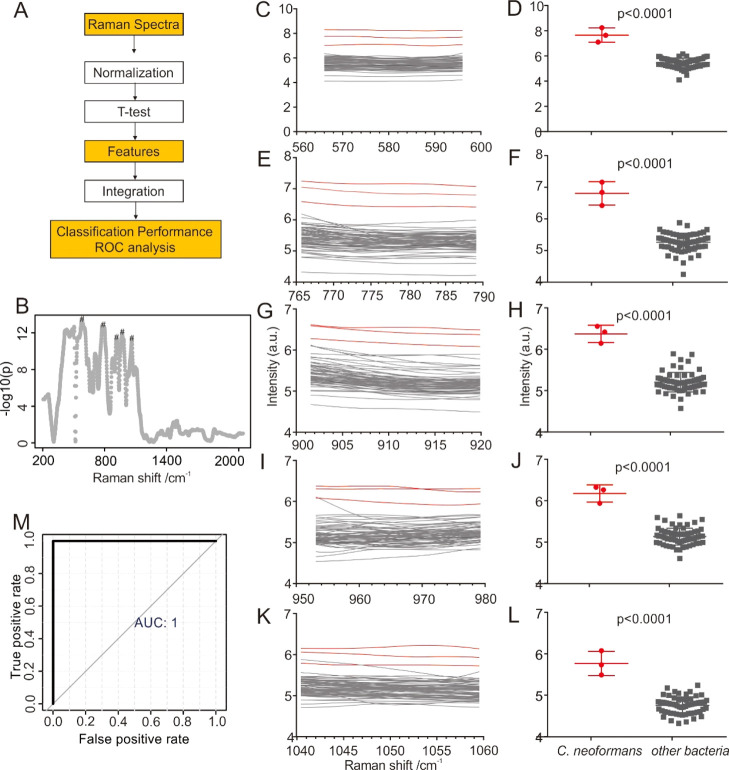
Figure 5.
(A) Schematic of the SERS data analysis pipeline. The details are as follows: The SERS spectra used as functions of the Raman frequency were normalized by MetaboAnalyst 4.0, using PQN. A t-test was used to unveil 5 features with the highest significance discriminating the spectra of a given strain from that of the collection of the remaining 21 bacterial strains. The corresponding SERS spectra of these five regions (features) ±5 cm–1 around these frequencies were integrated, and then, the integrals or peak ratios were used as the criteria to determine the diagnostic capabilities (ROC analysis). (B) Differences of C. neoformans SERS spectra as a function of the Raman frequency compared to the pool of the 21 bacteria t-test. The analysis was performed using MetaboAnalyst 4.0. This plot has been used to identify the five regions with the best discriminatory performance (labeled with an asterisk). The corresponding SERS spectra (C,E,G,I,K) and normalized intensities (D,F,H,J,L) of these five regions are shown on the right. The spectra of C. neoformans were marked with a red line, and other bacteria were marked with a gray line. (M) Comparison of integrals used in the ROC analysis.

