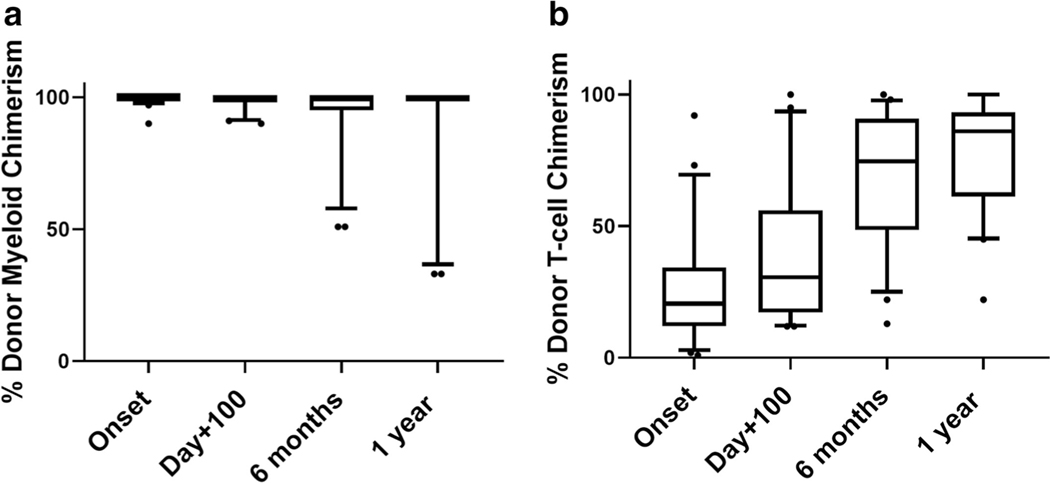
Fig. 1.
Donor myeloid and T cell chimerism in patients with mixed chimerism. a Donor myeloid chimerism (%) in patients with mixed chimerism (n = 23) at onset of mixed chimerism (range, 12–73 days), day + 100, 6 months, and 1-year post-transplant. Data represented as Tukey box-and-whisker plots. Each box is defined by the 25th and 75th percentiles of the data and represents the inter-quartile range (IQR). The median is represented by a solid horizontal line. Whiskers are extended from the box to the last value at < 1.5 IQR, towards the maximum and the minimum and outliers represented as round dots. b Donor T cell chimerism (%) in patients with mixed chimerism (n = 23) at onset of mixed chimerism (range, 12–73 days), day + 100, 6 months, and 1-year post-transplant. Data represented as Tukey box-and-whisker plots. Each box is defined by the 25th and 75th percentiles of the data and represents the inter-quartile range (IQR). The median is represented by a solid horizontal line. Whiskers are extended from the box to the last value at < 1.5 IQR, towards the maximum and the minimum and outliers represented as round dots

