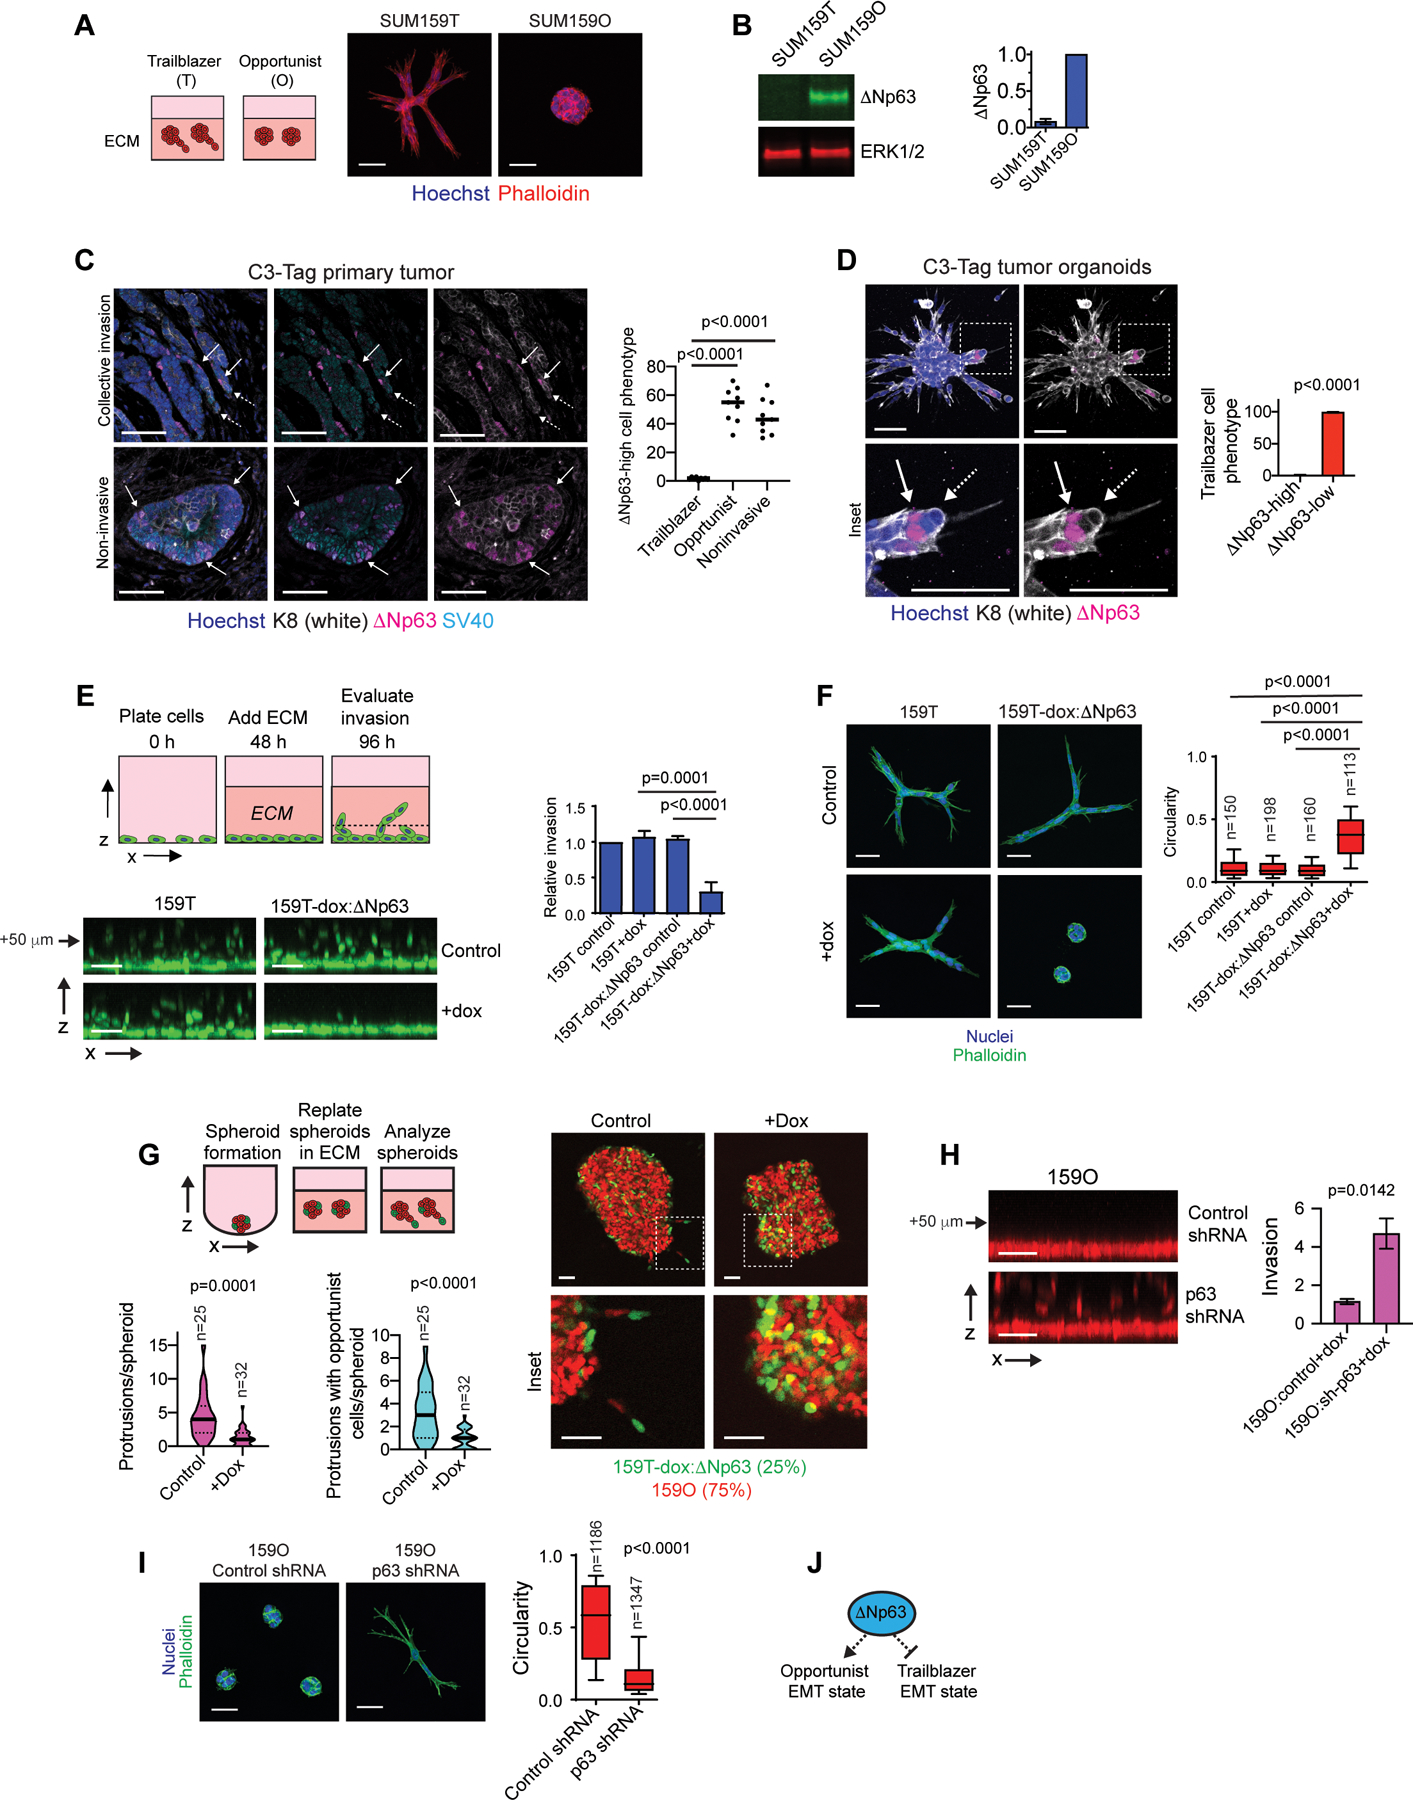
Figure 1. Expression of the transcription factor ΔNp63 distinguishes opportunist and trailblazer EMT programs.

(A) Representative spheroids at day 4 (n=3). (B) ΔNp63 expression in SUM159 trailblazer (SUM159T) and opportunist (SUM159O) populations (n=3). (C) ΔNp63 expression in C3-Tag tumors. Graph shows quantification of the ΔNp63-high cell phenotype from at least 2 10x fields of view at the tumor-stroma interface (mean±SD, n=9 mice). Solid arrow= ΔNp63-high, dashed arrow=ΔNp63-low. (D) Opportunistic invasion of ΔNp63-high cells in C3Tag tumor organoids. Graph shows quantification of ΔNp63 expression in trailblazer cells as a percentage of at least 528 total organoids per mouse (mean±SD, n=4 mice). (E) Doxycycline (dox) induced ΔNp63 expression suppresses vertical invasion (mean±SD, n=4). Arrow indicates distance of monolayer. (F) Dox induced ΔNp63 expression suppresses spheroid invasion over 72 h in ECM. Box and whisker plots (10–90 percentile) show the quantification of spheroid morphology (n=spheroids shown on graph). (G) Dox induced ΔNp63 expression in SUM159T cells (green) reduces the number of invasive LCPs and the opportunistic invasion of SUM159O cells (red). Violin plots show quantification of LCPs and the frequency of opportunistic SUM159O invasion. (H) Dox induced p63 shRNA promotes SUM159O invasion (mean±SEM, n=12). Arrow indicates distance of monolayer. (I) Dox induced p63 shRNA promotes SUM159O spheroid invasion over 48 h in ECM. Box and whisker plots (10–90 percentile) show quantification of spheroid circularity (n=spheroids shown on graph). (J) ΔNp63 prevents induction of a trailblazer state by restricting the ability of cells to form LCPs while promoting cell motility. P-values, two-tailed Student’s t-test (C-E and H) or Mann Whitney U test (F, G and I). Scale bars, 50 μm.
