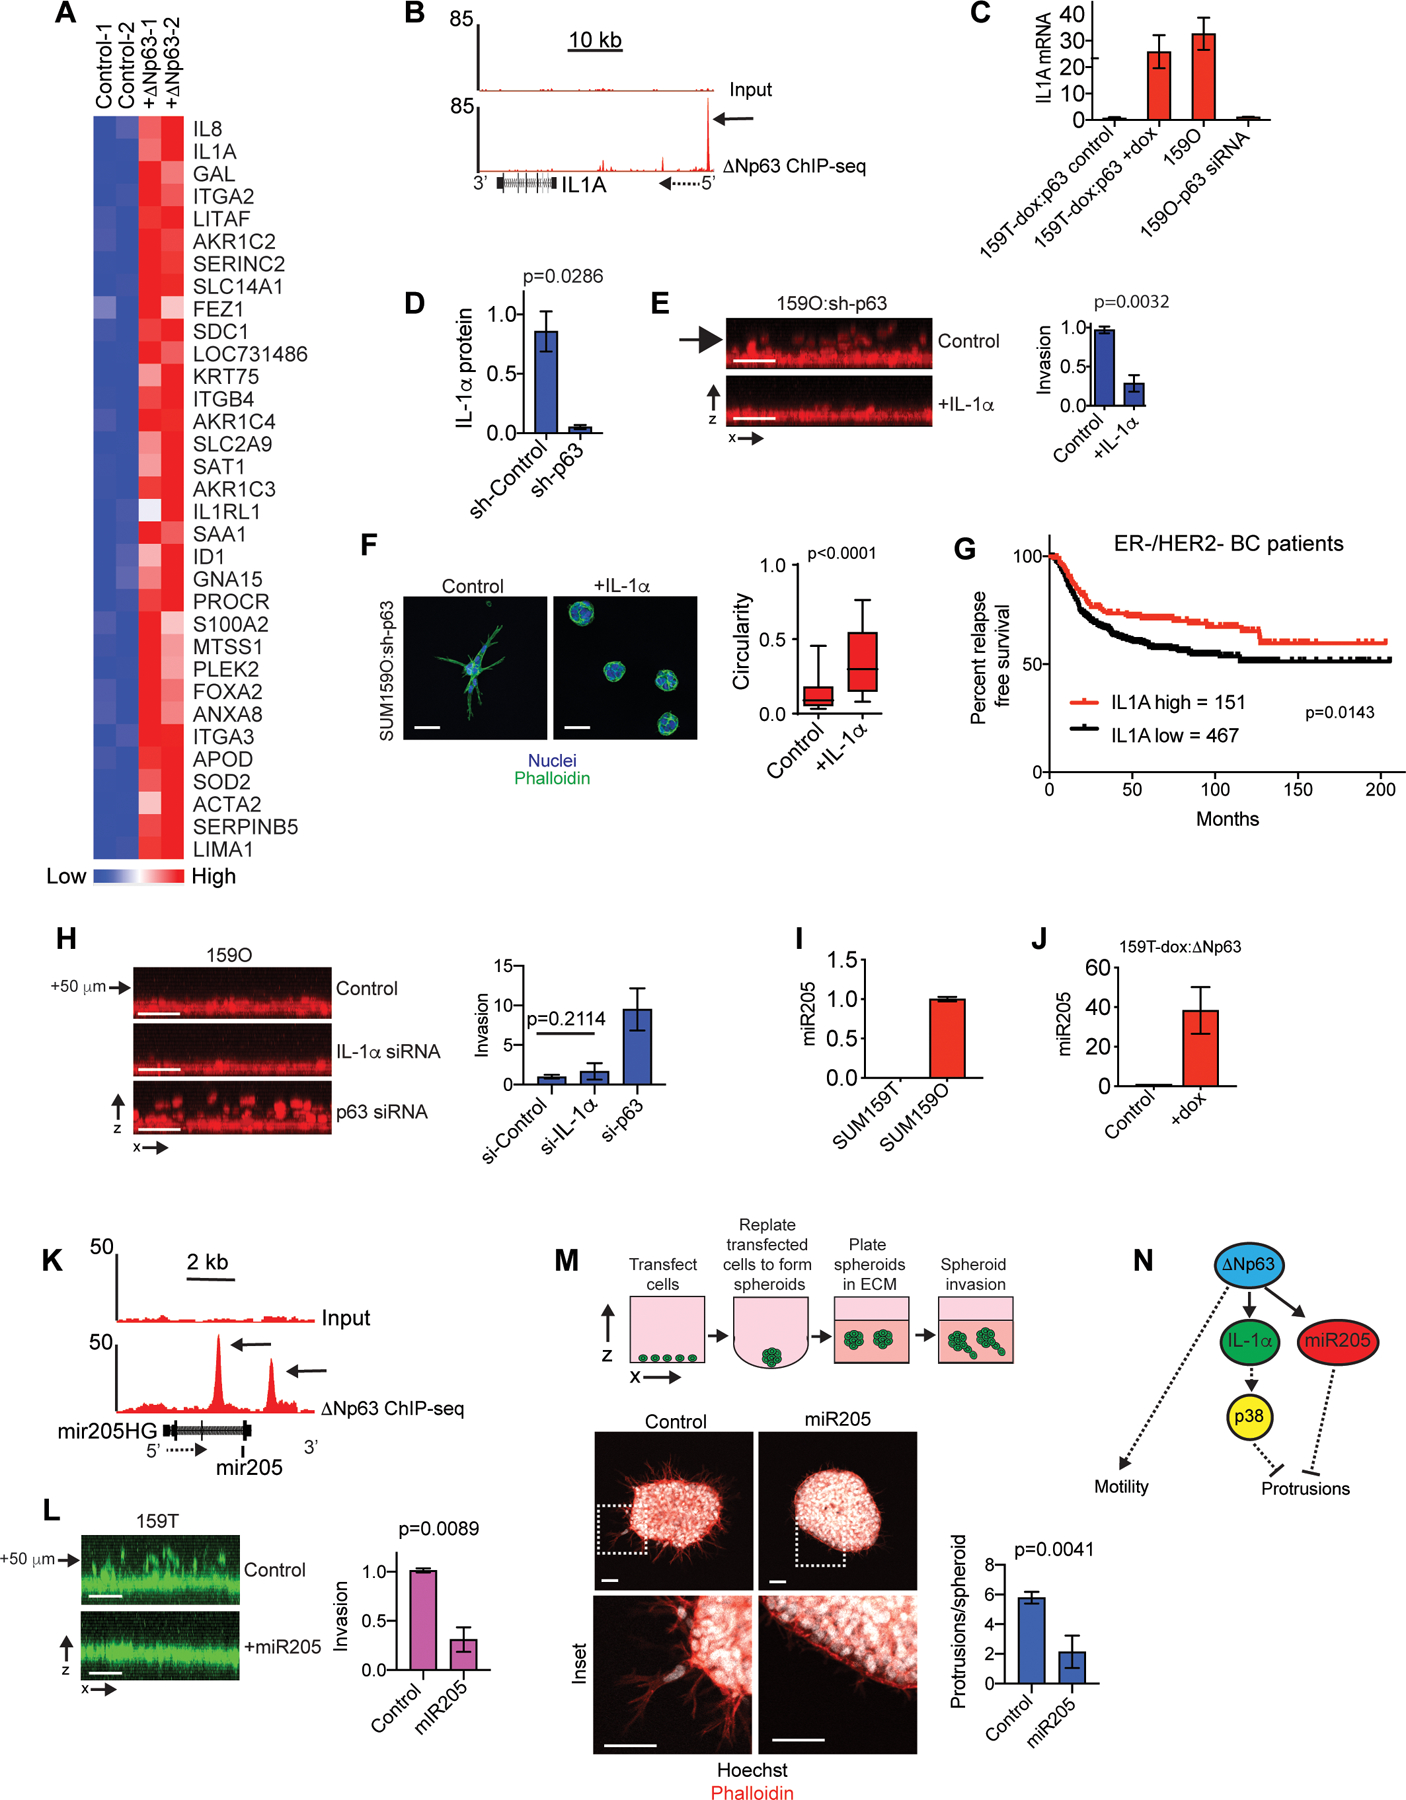
Figure 3. IL-1α and miR-205 are ΔNp63 targets that restrict invasion.

(A) Heatmap showing genes with a ≥2-fold increase in expression following 5 days of dox induced ΔNp63 expression. Biological replicates are shown. (B) ΔNp63 ChIP-seq and input DNA signals in the genomic regions surrounding the IL-1α gene. Solid arrow indicates the ΔNp63 binding site (C) qPCR results showing how dox induced ΔNp63 expression and p63 siRNA transfection influences IL-1α expression (mean±range, n=2). (D) ELISA results showing p63 shRNA reduces IL-1α in cell lysates. (E) IL-1α [10 ng/ml] suppresses SUM159O-shp63 invasion (mean ±SD, n=3). (F) Images showing how IL-1α influences the phenotype of ΔNp63 depleted SUM159O-shp63 cells plated onto a layer of ECM for 72 h. Scale bars, 50 μm. Box and whisker plot (10–90 percentile). Control (n=1569 spheroids) and + IL-1α (n=1461 spheroids). (G) Kaplan-Meier curves showing relapse-free survival of ER-/HER2- breast cancer patients classified as “IL-1α-high” (red) and “IL-1α-low” (black) based on IL-1α mRNA expression using KM Plotter. (H) x-z projections and quantification showing how IL-1α depletion influences invasion (mean±SD, n=5). Arrow indicates distance from monolayer. (I) qPCR showing miR205 expression (mean±range, n=2). (J) qPCR showing that ΔNp63 promotes miR205 expression, (mean±range, n=2). (K) ΔNp63 ChIP-seq and input DNA signals in the genomic regions surrounding miR205 and the miR205 host gene (miR205HG). Solid arrow indicates the ΔNp63 binding site and dashed arrow indicates gene orientation. (L) miR205 mimic transfection suppresses vertical invasion (mean±SD, n=3). Arrow indicates distance from monolayer. (M) miR205 mimic transfection suppresses SUM159T cells LCP formation (mean±SEM, n=19 spheroids (Control) and 14 spheroids (miR205)). (N) The ΔNp63 targets IL-1α and miR205 restrict the formation of LCPs that are necessary to initiate collective invasion. P-values, two-tailed Student’s t-test (E, H, L), Mann-Whitney U test (D, M), and log-rank (Mantel-Cox) test (I). Scale bars, 50 μm.
