
Figure 2: Profile of HBV-specific T cell responses in all patient groups.
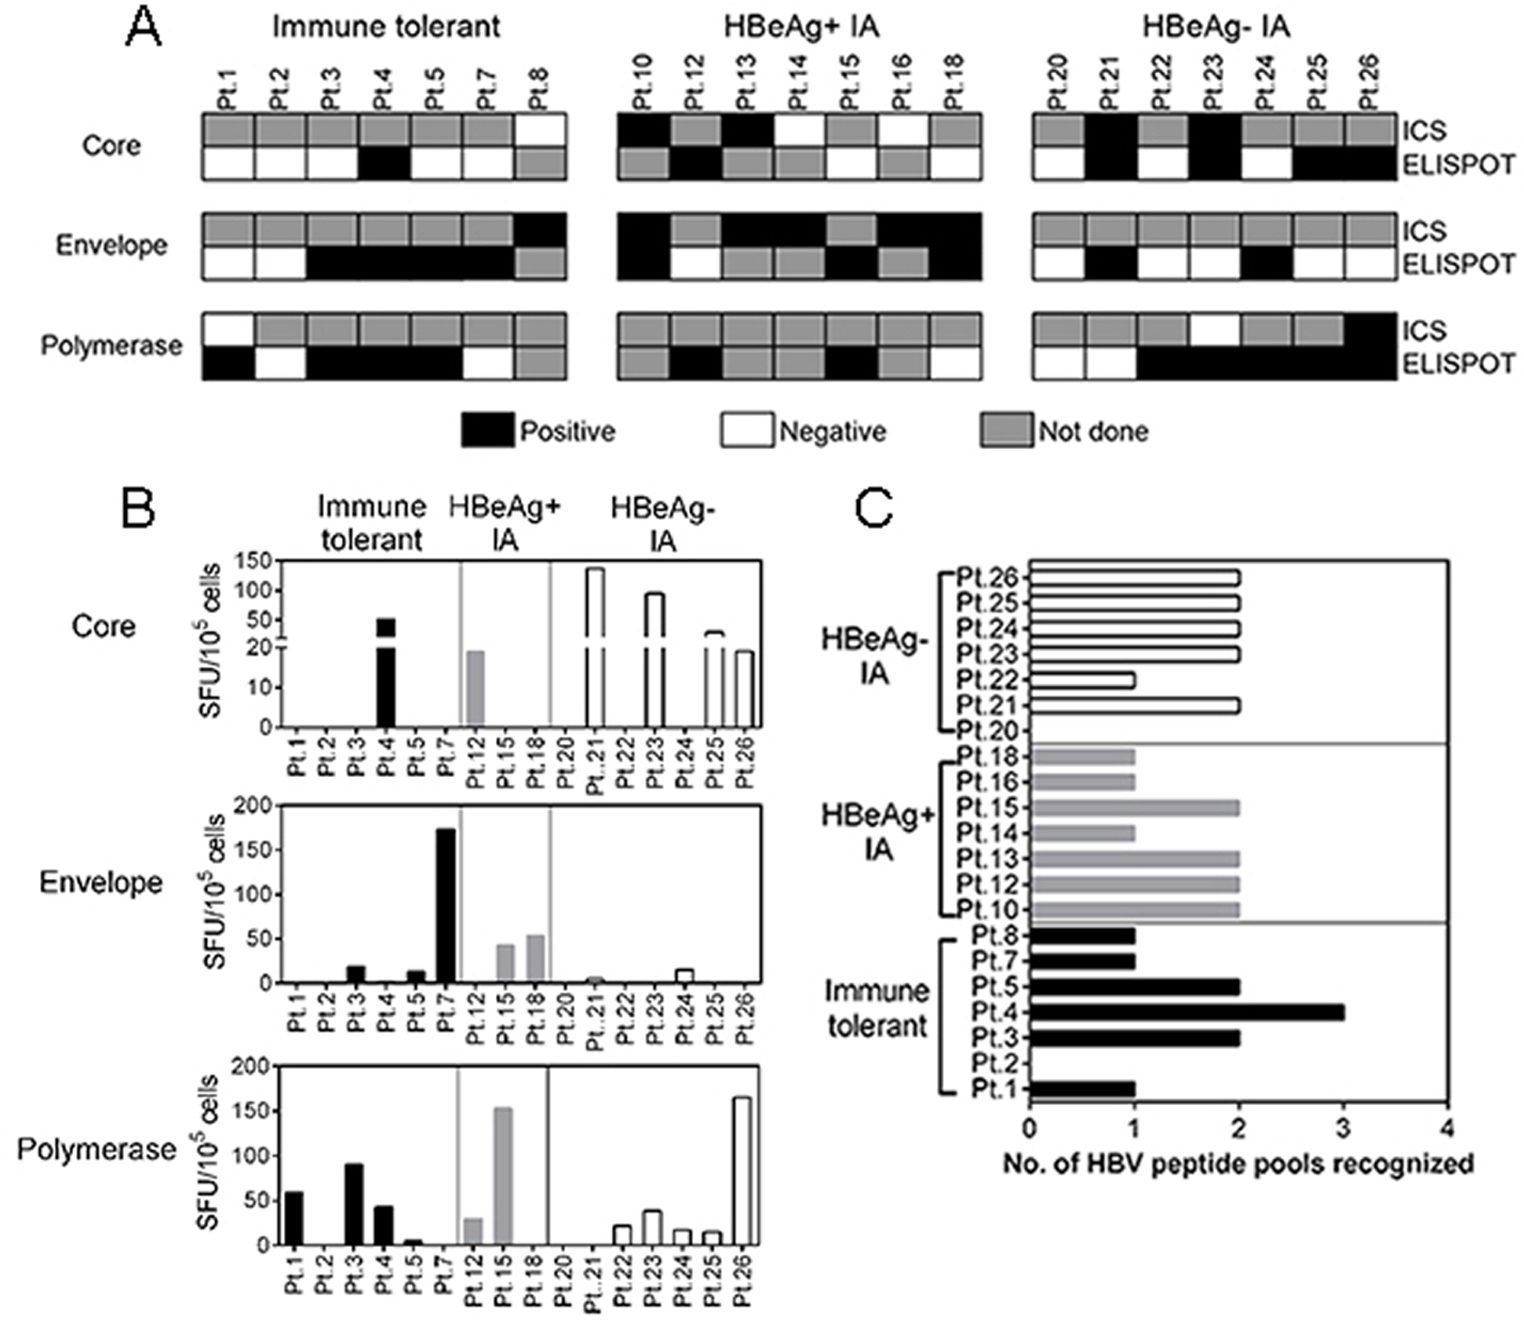
Patient PBMC were analyzed by ELISPOT and intracellular cytokine staining (ICS) for IFN-γ. (A) Evidence of HBV-specific T cell responses by ELISPOT and ICS against the Core, Envelope and Polymerase proteins, for each patient in the groups studied; Shaded black – positive HBV-specific T cell response; unshaded squares – negative HBV-specific T cell response, shaded grey – sample not done. (B) Comparison of spot forming units (SFU) by ELISPOT, in each patient, in the different groups; immune tolerant (IT) (shaded black), HBeAg(+) IA (shaded grey) and HBeAg(−) IA (unshaded). Bars represent the number of SFU cells in response to HBV core, envelope, and polymerase peptide pools. (C) Number of HBV peptide pools recognized by HBV-specific T cells obtained in the indicated patients.