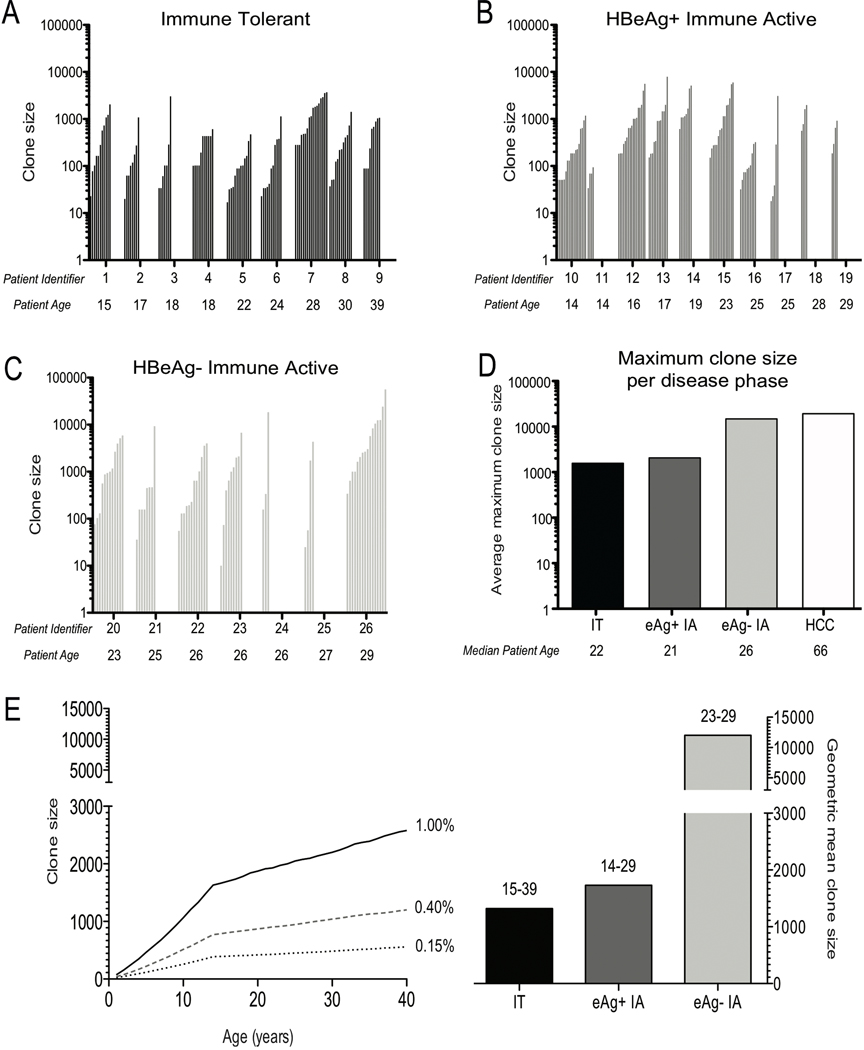
Figure 5: Hepatocyte clones detected in all patient groups.
Hepatocyte clones in (A) IT disease (Group 1), (B) HBeAg(+) IA disease (Group 2) and (C) HBeAg(−) IA disease (Group 3). Clone sizes were estimated as described. (Figure 1, Materials and Methods and Supplementary Materials & Methods). The point estimates for clone size were calculated using the program Sim19 (Supplementary Materials & Methods). Clones are grouped by increasing size for each patient, and patients within a group are arranged by increasing age from left to right. D) Mean of the maximum clone size for each patient within a group. Geometric means were calculated using the point estimates in Supplementary Table 4. HCC data are from a published analysis of clone sizes in non-tumorous liver from a group of 5 non-cirrhotic HCC patients.25 (E) Predicted maximum clone sizes vs. age. These were calculated using the Csize8 program (Materials and Methods and Supplementary Materials & Methods), for 3 different daily rate constants for hepatocyte turnover; k=0.0015/day (0.15%) - (black dashed line); k=0.004/day (0.40%) – (grey dashed line) and k=0.01/day (1.00%) - (solid black line). The adjacent corresponding bars indicate the geometric mean hepatocyte clone size, for each patient group in (D), for comparison against the predicted maximum clone size.

