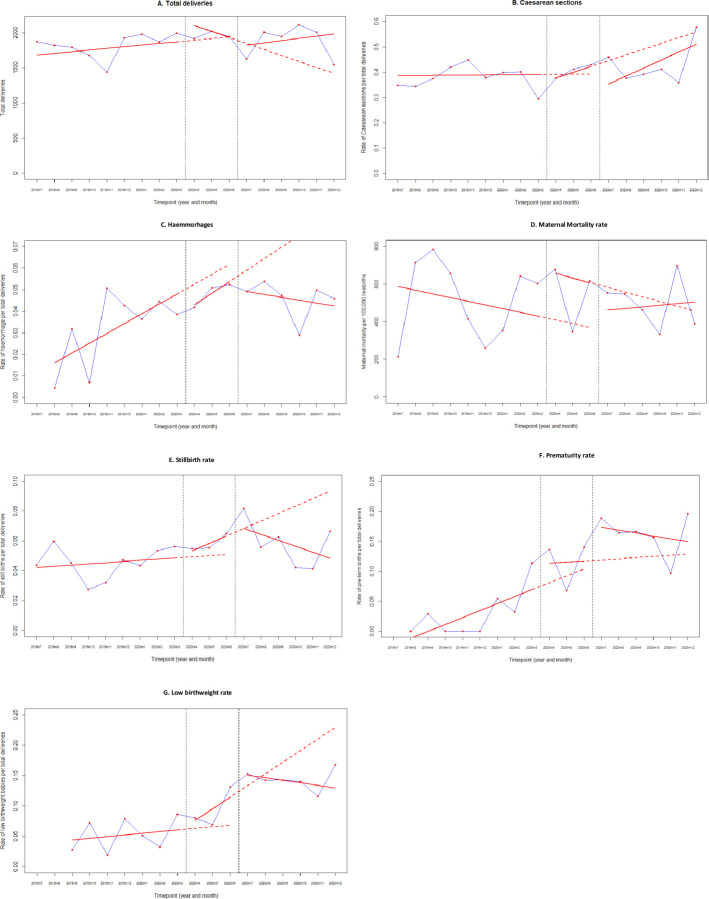
Figure 2.
Labour and delivery indicators for Kawempe National Referral Hospital (KNRH), July 2019 to December 2020. Interrupted time-series analyses with generalised least square regression for (A) total deliveries, (B) caesarean sections, (C) haemorrhage related to labour and delivery, (D) maternal mortality, expressed as rate per 100 000 maternities, (E) stillbirth rate as a percentage of deliveries, (F) preterm birth rate as a percentage of total livebirths, (G) low birth weight as a percentage of total livebirths, before, during and after the COVID-19 lockdown in KNRH. Red dots represent numbers/rates per month. Blue lines connect the red dots to display the observed monthly trend. Red solid lines represent the fitted regression models. Red dashed lines represent the counterfactual scenario.

