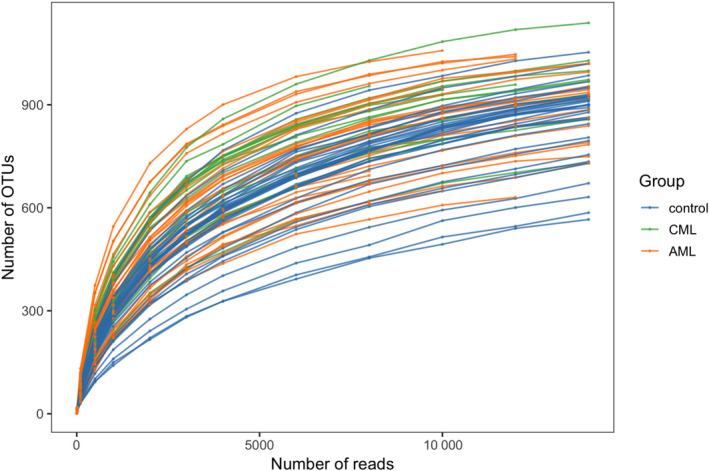
Fig. 1.

Rarefaction curve. X‐coordinate: the number of randomly selected sequencing bars; Y‐coordinate: the α‐diversity index calculated based on the number of sequencing bars. The curves of different colors represent different samples.

Rarefaction curve. X‐coordinate: the number of randomly selected sequencing bars; Y‐coordinate: the α‐diversity index calculated based on the number of sequencing bars. The curves of different colors represent different samples.