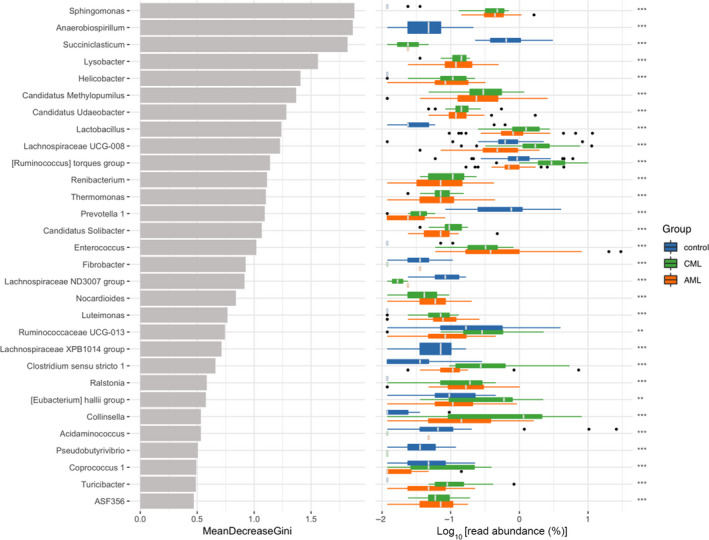
Fig. 5.

Gut microbial composition of myeloid patients (P group) and HCs (N group). Left panel: the average decrease value of the Gini index (the horizontal coordinate) and the classification information of genus (the vertical coordinate); right panel: the box diagram of the class group abundance of different groups in which the * represents the significance of differences between groups (Kruskal–Wallis rank sum test; ***P < 0.001; **P < 0.01). Categories that do not have accurate classification information are not analyzed.
