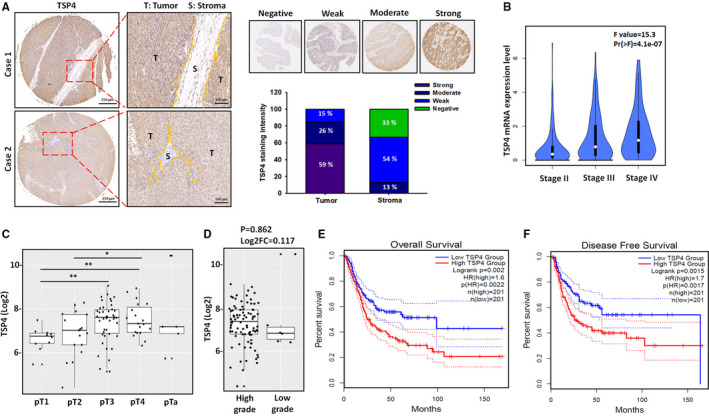
FIGURE 1.

TSP4 expression in human BC tissues. A, Representative images of immunohistochemical staining for Thrombospondins‐4 (TSP4) in human bladder cancer (BC) tissues. B, The relationship between TSP4 expression and clinical stages of BC was analysed using the Gene Expression Profiling Interactive Analysis 2 (GEPIA2) web server. The F value is representative of the F test. C and D, The Gene Expression database of Normal and Tumor tissues 2 (GENT2) web server was used to analyse the correlations among TSP4 expression, primary tumour status, and tumour grade. E and F, The overall survival and disease‐free survival rates were analysed between high and low TSP4 groups in the GEPIA2 web server. All data are expressed in terms of mean ± SD in triplicate samples. *P < .05, **P < .01 relative to the control group
